Cypriot vs Immigrants from Ethiopia Ambulatory Disability
COMPARE
Cypriot
Immigrants from Ethiopia
Ambulatory Disability
Ambulatory Disability Comparison
Cypriots
Immigrants from Ethiopia
5.5%
AMBULATORY DISABILITY
100.0/ 100
METRIC RATING
38th/ 347
METRIC RANK
5.4%
AMBULATORY DISABILITY
100.0/ 100
METRIC RATING
17th/ 347
METRIC RANK
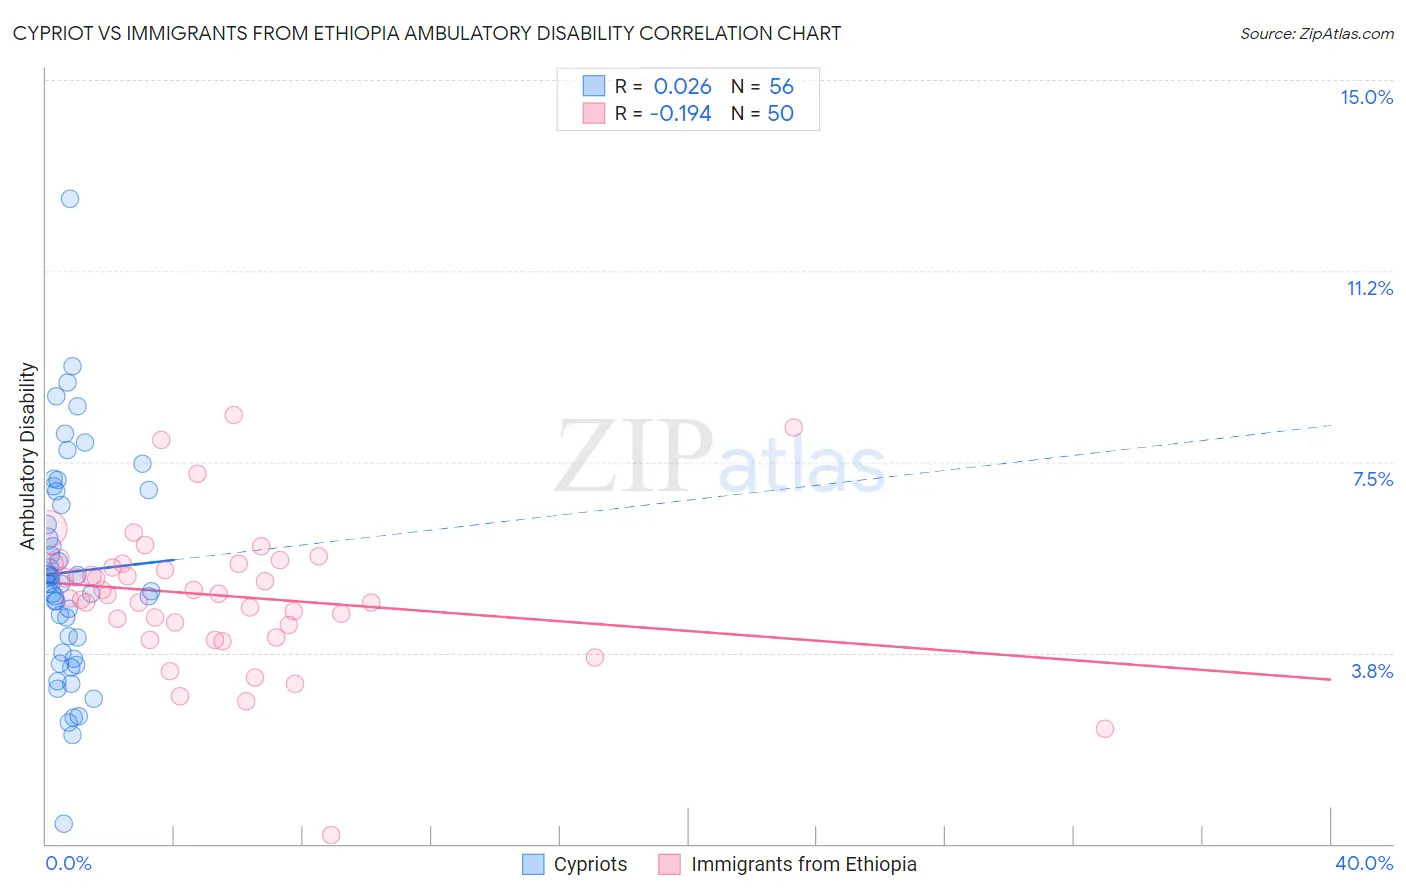
Cypriot vs Immigrants from Ethiopia Ambulatory Disability Correlation Chart
The statistical analysis conducted on geographies consisting of 61,870,126 people shows no correlation between the proportion of Cypriots and percentage of population with ambulatory disability in the United States with a correlation coefficient (R) of 0.026 and weighted average of 5.5%. Similarly, the statistical analysis conducted on geographies consisting of 211,510,765 people shows a poor negative correlation between the proportion of Immigrants from Ethiopia and percentage of population with ambulatory disability in the United States with a correlation coefficient (R) of -0.194 and weighted average of 5.4%, a difference of 2.3%.
Ambulatory Disability Correlation Summary
| Measurement | Cypriot | Immigrants from Ethiopia |
| Minimum | 0.38% | 0.17% |
| Maximum | 12.7% | 8.4% |
| Range | 12.3% | 8.2% |
| Mean | 5.3% | 4.9% |
| Median | 5.1% | 4.9% |
| Interquartile 25% (IQ1) | 3.9% | 4.3% |
| Interquartile 75% (IQ3) | 6.8% | 5.5% |
| Interquartile Range (IQR) | 2.9% | 1.2% |
| Standard Deviation (Sample) | 2.1% | 1.4% |
| Standard Deviation (Population) | 2.1% | 1.4% |
Similar Demographics by Ambulatory Disability
Demographics Similar to Cypriots by Ambulatory Disability
In terms of ambulatory disability, the demographic groups most similar to Cypriots are Turkish (5.5%, a difference of 0.010%), Immigrants from Malaysia (5.5%, a difference of 0.020%), Afghan (5.5%, a difference of 0.090%), Immigrants from Eritrea (5.5%, a difference of 0.090%), and Immigrants from Asia (5.5%, a difference of 0.13%).
| Demographics | Rating | Rank | Ambulatory Disability |
| Immigrants | Venezuela | 100.0 /100 | #31 | Exceptional 5.4% |
| Immigrants | Australia | 100.0 /100 | #32 | Exceptional 5.5% |
| Immigrants | Pakistan | 100.0 /100 | #33 | Exceptional 5.5% |
| Immigrants | Asia | 100.0 /100 | #34 | Exceptional 5.5% |
| Afghans | 100.0 /100 | #35 | Exceptional 5.5% |
| Immigrants | Malaysia | 100.0 /100 | #36 | Exceptional 5.5% |
| Turks | 100.0 /100 | #37 | Exceptional 5.5% |
| Cypriots | 100.0 /100 | #38 | Exceptional 5.5% |
| Immigrants | Eritrea | 100.0 /100 | #39 | Exceptional 5.5% |
| Venezuelans | 99.9 /100 | #40 | Exceptional 5.5% |
| Mongolians | 99.9 /100 | #41 | Exceptional 5.5% |
| Argentineans | 99.9 /100 | #42 | Exceptional 5.5% |
| Paraguayans | 99.9 /100 | #43 | Exceptional 5.5% |
| Immigrants | Indonesia | 99.9 /100 | #44 | Exceptional 5.5% |
| Immigrants | Sweden | 99.9 /100 | #45 | Exceptional 5.6% |
Demographics Similar to Immigrants from Ethiopia by Ambulatory Disability
In terms of ambulatory disability, the demographic groups most similar to Immigrants from Ethiopia are Immigrants from Sri Lanka (5.4%, a difference of 0.010%), Indian (Asian) (5.4%, a difference of 0.11%), Ethiopian (5.4%, a difference of 0.13%), Immigrants from Kuwait (5.4%, a difference of 0.13%), and Immigrants from Hong Kong (5.3%, a difference of 0.34%).
| Demographics | Rating | Rank | Ambulatory Disability |
| Yup'ik | 100.0 /100 | #10 | Exceptional 5.2% |
| Immigrants | Korea | 100.0 /100 | #11 | Exceptional 5.2% |
| Okinawans | 100.0 /100 | #12 | Exceptional 5.3% |
| Burmese | 100.0 /100 | #13 | Exceptional 5.3% |
| Immigrants | Eastern Asia | 100.0 /100 | #14 | Exceptional 5.3% |
| Immigrants | China | 100.0 /100 | #15 | Exceptional 5.3% |
| Immigrants | Hong Kong | 100.0 /100 | #16 | Exceptional 5.3% |
| Immigrants | Ethiopia | 100.0 /100 | #17 | Exceptional 5.4% |
| Immigrants | Sri Lanka | 100.0 /100 | #18 | Exceptional 5.4% |
| Indians (Asian) | 100.0 /100 | #19 | Exceptional 5.4% |
| Ethiopians | 100.0 /100 | #20 | Exceptional 5.4% |
| Immigrants | Kuwait | 100.0 /100 | #21 | Exceptional 5.4% |
| Immigrants | Israel | 100.0 /100 | #22 | Exceptional 5.4% |
| Tongans | 100.0 /100 | #23 | Exceptional 5.4% |
| Immigrants | Saudi Arabia | 100.0 /100 | #24 | Exceptional 5.4% |