Cuban vs Immigrants from Kazakhstan Self-Care Disability
COMPARE
Cuban
Immigrants from Kazakhstan
Self-Care Disability
Self-Care Disability Comparison
Cubans
Immigrants from Kazakhstan
2.7%
SELF-CARE DISABILITY
0.0/ 100
METRIC RATING
290th/ 347
METRIC RANK
2.5%
SELF-CARE DISABILITY
46.7/ 100
METRIC RATING
177th/ 347
METRIC RANK
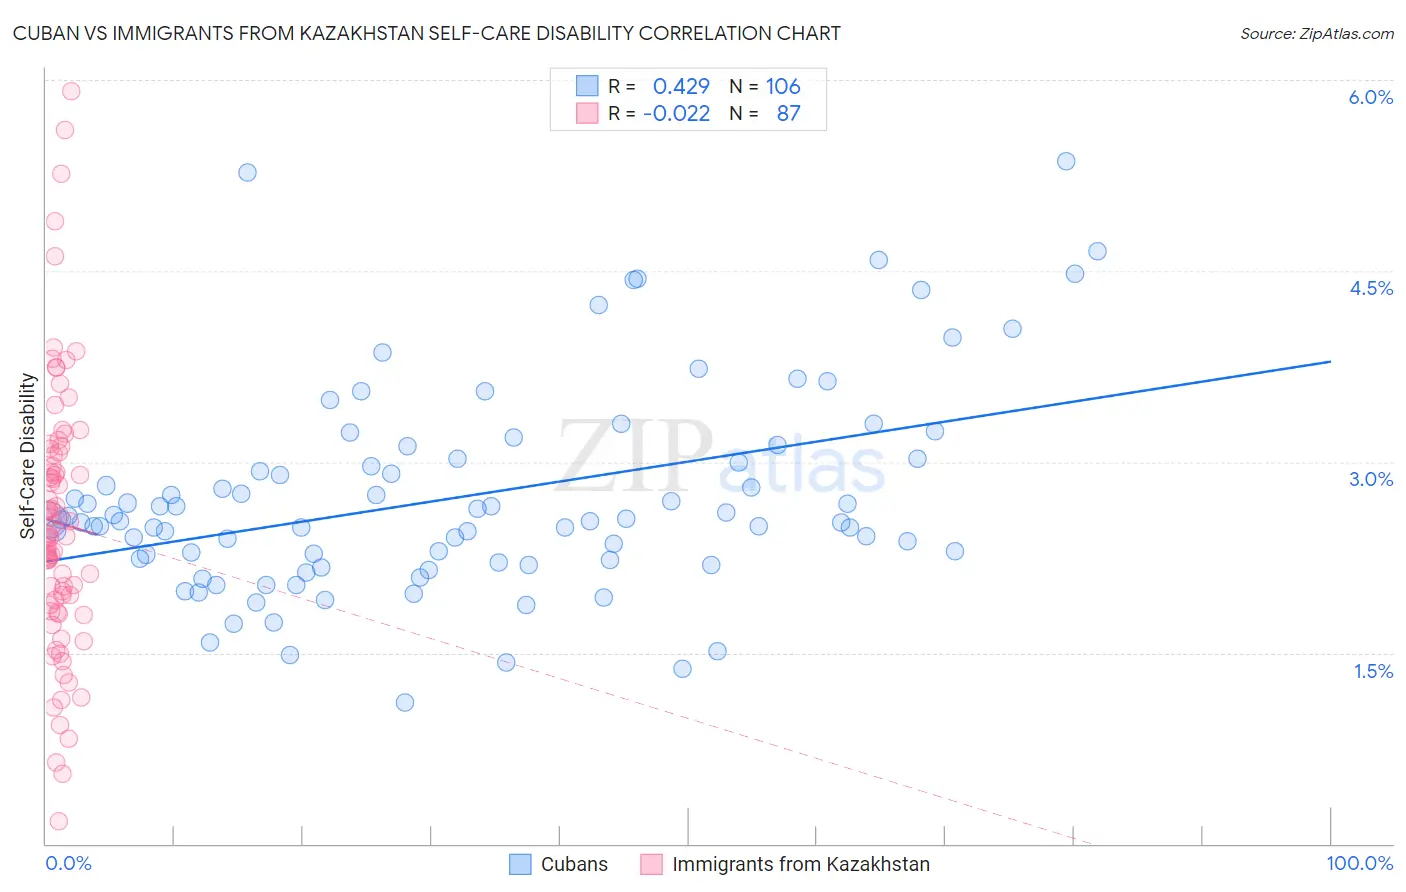
Cuban vs Immigrants from Kazakhstan Self-Care Disability Correlation Chart
The statistical analysis conducted on geographies consisting of 448,682,941 people shows a moderate positive correlation between the proportion of Cubans and percentage of population with self-care disability in the United States with a correlation coefficient (R) of 0.429 and weighted average of 2.7%. Similarly, the statistical analysis conducted on geographies consisting of 124,334,513 people shows no correlation between the proportion of Immigrants from Kazakhstan and percentage of population with self-care disability in the United States with a correlation coefficient (R) of -0.022 and weighted average of 2.5%, a difference of 10.5%.
Self-Care Disability Correlation Summary
| Measurement | Cuban | Immigrants from Kazakhstan |
| Minimum | 1.1% | 0.18% |
| Maximum | 5.4% | 5.9% |
| Range | 4.3% | 5.7% |
| Mean | 2.7% | 2.5% |
| Median | 2.5% | 2.4% |
| Interquartile 25% (IQ1) | 2.2% | 1.9% |
| Interquartile 75% (IQ3) | 3.0% | 3.1% |
| Interquartile Range (IQR) | 0.80% | 1.2% |
| Standard Deviation (Sample) | 0.82% | 1.1% |
| Standard Deviation (Population) | 0.81% | 1.1% |
Similar Demographics by Self-Care Disability
Demographics Similar to Cubans by Self-Care Disability
In terms of self-care disability, the demographic groups most similar to Cubans are African (2.7%, a difference of 0.15%), Immigrants from Barbados (2.7%, a difference of 0.25%), Guyanese (2.7%, a difference of 0.26%), Immigrants from Jamaica (2.7%, a difference of 0.29%), and Central American Indian (2.7%, a difference of 0.42%).
| Demographics | Rating | Rank | Self-Care Disability |
| Delaware | 0.0 /100 | #283 | Tragic 2.7% |
| Fijians | 0.0 /100 | #284 | Tragic 2.7% |
| Jamaicans | 0.0 /100 | #285 | Tragic 2.7% |
| French American Indians | 0.0 /100 | #286 | Tragic 2.7% |
| Immigrants | Jamaica | 0.0 /100 | #287 | Tragic 2.7% |
| Immigrants | Barbados | 0.0 /100 | #288 | Tragic 2.7% |
| Africans | 0.0 /100 | #289 | Tragic 2.7% |
| Cubans | 0.0 /100 | #290 | Tragic 2.7% |
| Guyanese | 0.0 /100 | #291 | Tragic 2.7% |
| Central American Indians | 0.0 /100 | #292 | Tragic 2.7% |
| Belizeans | 0.0 /100 | #293 | Tragic 2.7% |
| Blackfeet | 0.0 /100 | #294 | Tragic 2.7% |
| Barbadians | 0.0 /100 | #295 | Tragic 2.7% |
| Immigrants | Portugal | 0.0 /100 | #296 | Tragic 2.8% |
| West Indians | 0.0 /100 | #297 | Tragic 2.8% |
Demographics Similar to Immigrants from Kazakhstan by Self-Care Disability
In terms of self-care disability, the demographic groups most similar to Immigrants from Kazakhstan are English (2.5%, a difference of 0.020%), Immigrants from Afghanistan (2.5%, a difference of 0.040%), Hungarian (2.5%, a difference of 0.060%), Immigrants from Bosnia and Herzegovina (2.5%, a difference of 0.14%), and Welsh (2.5%, a difference of 0.16%).
| Demographics | Rating | Rank | Self-Care Disability |
| Scottish | 54.3 /100 | #170 | Average 2.5% |
| Pennsylvania Germans | 53.5 /100 | #171 | Average 2.5% |
| Czechoslovakians | 53.5 /100 | #172 | Average 2.5% |
| Immigrants | Burma/Myanmar | 52.8 /100 | #173 | Average 2.5% |
| Welsh | 50.0 /100 | #174 | Average 2.5% |
| Immigrants | Bosnia and Herzegovina | 49.6 /100 | #175 | Average 2.5% |
| Immigrants | Afghanistan | 47.6 /100 | #176 | Average 2.5% |
| Immigrants | Kazakhstan | 46.7 /100 | #177 | Average 2.5% |
| English | 46.2 /100 | #178 | Average 2.5% |
| Hungarians | 45.5 /100 | #179 | Average 2.5% |
| Indonesians | 41.2 /100 | #180 | Average 2.5% |
| Ghanaians | 40.4 /100 | #181 | Average 2.5% |
| Maltese | 37.5 /100 | #182 | Fair 2.5% |
| Salvadorans | 36.4 /100 | #183 | Fair 2.5% |
| Yugoslavians | 36.1 /100 | #184 | Fair 2.5% |