Cuban vs Immigrants from Ethiopia Self-Care Disability
COMPARE
Cuban
Immigrants from Ethiopia
Self-Care Disability
Self-Care Disability Comparison
Cubans
Immigrants from Ethiopia
2.7%
SELF-CARE DISABILITY
0.0/ 100
METRIC RATING
290th/ 347
METRIC RANK
2.2%
SELF-CARE DISABILITY
100.0/ 100
METRIC RATING
12th/ 347
METRIC RANK
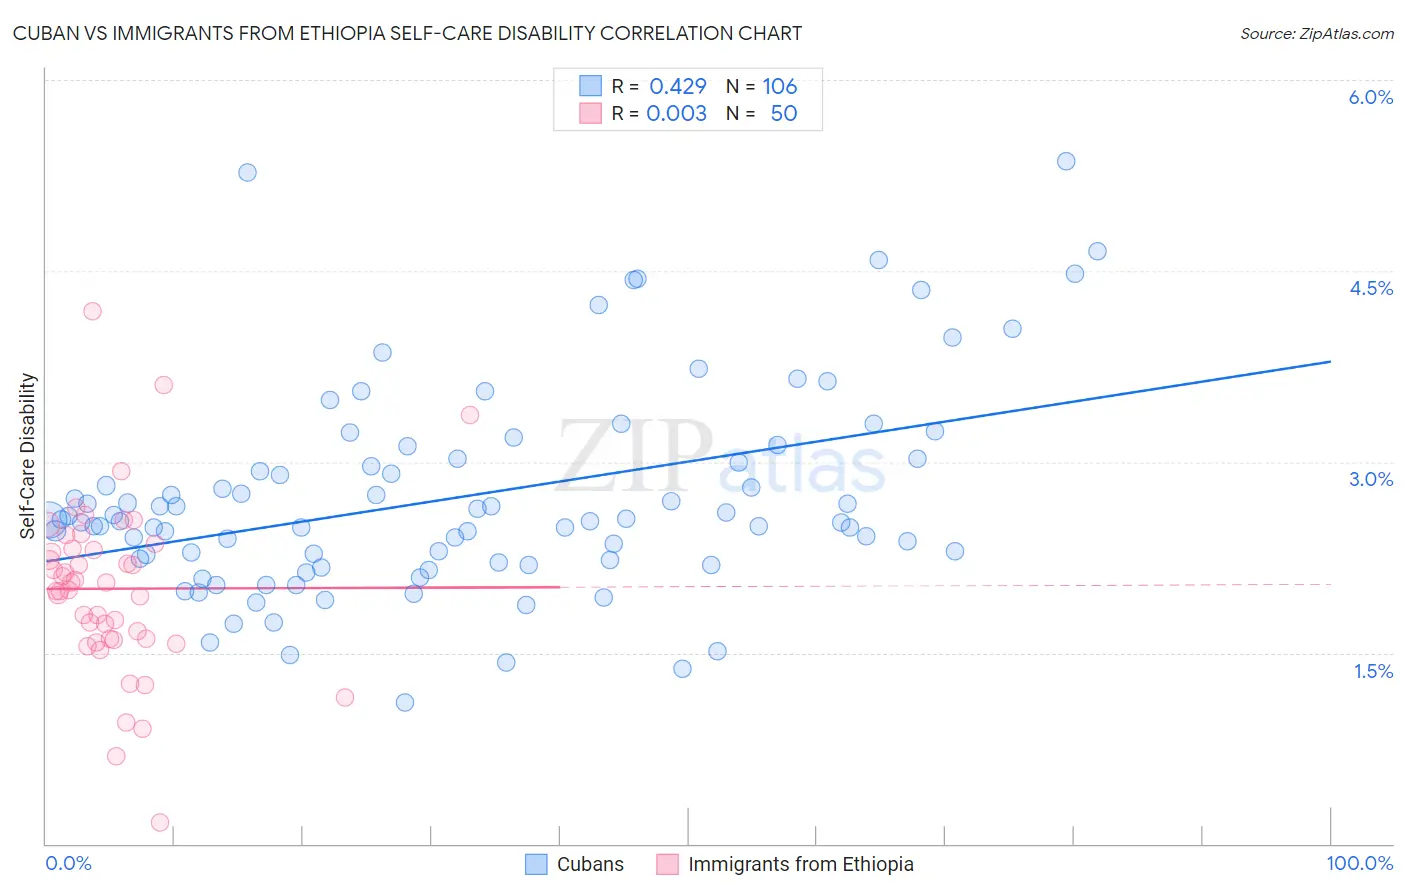
Cuban vs Immigrants from Ethiopia Self-Care Disability Correlation Chart
The statistical analysis conducted on geographies consisting of 448,682,941 people shows a moderate positive correlation between the proportion of Cubans and percentage of population with self-care disability in the United States with a correlation coefficient (R) of 0.429 and weighted average of 2.7%. Similarly, the statistical analysis conducted on geographies consisting of 211,457,724 people shows no correlation between the proportion of Immigrants from Ethiopia and percentage of population with self-care disability in the United States with a correlation coefficient (R) of 0.003 and weighted average of 2.2%, a difference of 24.4%.
Self-Care Disability Correlation Summary
| Measurement | Cuban | Immigrants from Ethiopia |
| Minimum | 1.1% | 0.17% |
| Maximum | 5.4% | 4.2% |
| Range | 4.3% | 4.0% |
| Mean | 2.7% | 2.0% |
| Median | 2.5% | 2.0% |
| Interquartile 25% (IQ1) | 2.2% | 1.6% |
| Interquartile 75% (IQ3) | 3.0% | 2.3% |
| Interquartile Range (IQR) | 0.80% | 0.71% |
| Standard Deviation (Sample) | 0.82% | 0.69% |
| Standard Deviation (Population) | 0.81% | 0.69% |
Similar Demographics by Self-Care Disability
Demographics Similar to Cubans by Self-Care Disability
In terms of self-care disability, the demographic groups most similar to Cubans are African (2.7%, a difference of 0.15%), Immigrants from Barbados (2.7%, a difference of 0.25%), Guyanese (2.7%, a difference of 0.26%), Immigrants from Jamaica (2.7%, a difference of 0.29%), and Central American Indian (2.7%, a difference of 0.42%).
| Demographics | Rating | Rank | Self-Care Disability |
| Delaware | 0.0 /100 | #283 | Tragic 2.7% |
| Fijians | 0.0 /100 | #284 | Tragic 2.7% |
| Jamaicans | 0.0 /100 | #285 | Tragic 2.7% |
| French American Indians | 0.0 /100 | #286 | Tragic 2.7% |
| Immigrants | Jamaica | 0.0 /100 | #287 | Tragic 2.7% |
| Immigrants | Barbados | 0.0 /100 | #288 | Tragic 2.7% |
| Africans | 0.0 /100 | #289 | Tragic 2.7% |
| Cubans | 0.0 /100 | #290 | Tragic 2.7% |
| Guyanese | 0.0 /100 | #291 | Tragic 2.7% |
| Central American Indians | 0.0 /100 | #292 | Tragic 2.7% |
| Belizeans | 0.0 /100 | #293 | Tragic 2.7% |
| Blackfeet | 0.0 /100 | #294 | Tragic 2.7% |
| Barbadians | 0.0 /100 | #295 | Tragic 2.7% |
| Immigrants | Portugal | 0.0 /100 | #296 | Tragic 2.8% |
| West Indians | 0.0 /100 | #297 | Tragic 2.8% |
Demographics Similar to Immigrants from Ethiopia by Self-Care Disability
In terms of self-care disability, the demographic groups most similar to Immigrants from Ethiopia are Ethiopian (2.2%, a difference of 0.010%), Immigrants from South Central Asia (2.2%, a difference of 0.050%), Sudanese (2.2%, a difference of 0.16%), Luxembourger (2.2%, a difference of 0.17%), and Okinawan (2.2%, a difference of 0.18%).
| Demographics | Rating | Rank | Self-Care Disability |
| Zimbabweans | 100.0 /100 | #5 | Exceptional 2.2% |
| Filipinos | 100.0 /100 | #6 | Exceptional 2.2% |
| Immigrants | Bolivia | 100.0 /100 | #7 | Exceptional 2.2% |
| Bolivians | 100.0 /100 | #8 | Exceptional 2.2% |
| Immigrants | Nepal | 100.0 /100 | #9 | Exceptional 2.2% |
| Sudanese | 100.0 /100 | #10 | Exceptional 2.2% |
| Immigrants | South Central Asia | 100.0 /100 | #11 | Exceptional 2.2% |
| Immigrants | Ethiopia | 100.0 /100 | #12 | Exceptional 2.2% |
| Ethiopians | 100.0 /100 | #13 | Exceptional 2.2% |
| Luxembourgers | 100.0 /100 | #14 | Exceptional 2.2% |
| Okinawans | 100.0 /100 | #15 | Exceptional 2.2% |
| Immigrants | Kuwait | 100.0 /100 | #16 | Exceptional 2.2% |
| Immigrants | Saudi Arabia | 100.0 /100 | #17 | Exceptional 2.2% |
| Immigrants | Taiwan | 100.0 /100 | #18 | Exceptional 2.2% |
| Immigrants | Eritrea | 100.0 /100 | #19 | Exceptional 2.2% |