Crow vs Immigrants from Sri Lanka Disability
COMPARE
Crow
Immigrants from Sri Lanka
Disability
Disability Comparison
Crow
Immigrants from Sri Lanka
12.9%
DISABILITY
0.0/ 100
METRIC RATING
285th/ 347
METRIC RANK
10.5%
DISABILITY
100.0/ 100
METRIC RATING
22nd/ 347
METRIC RANK
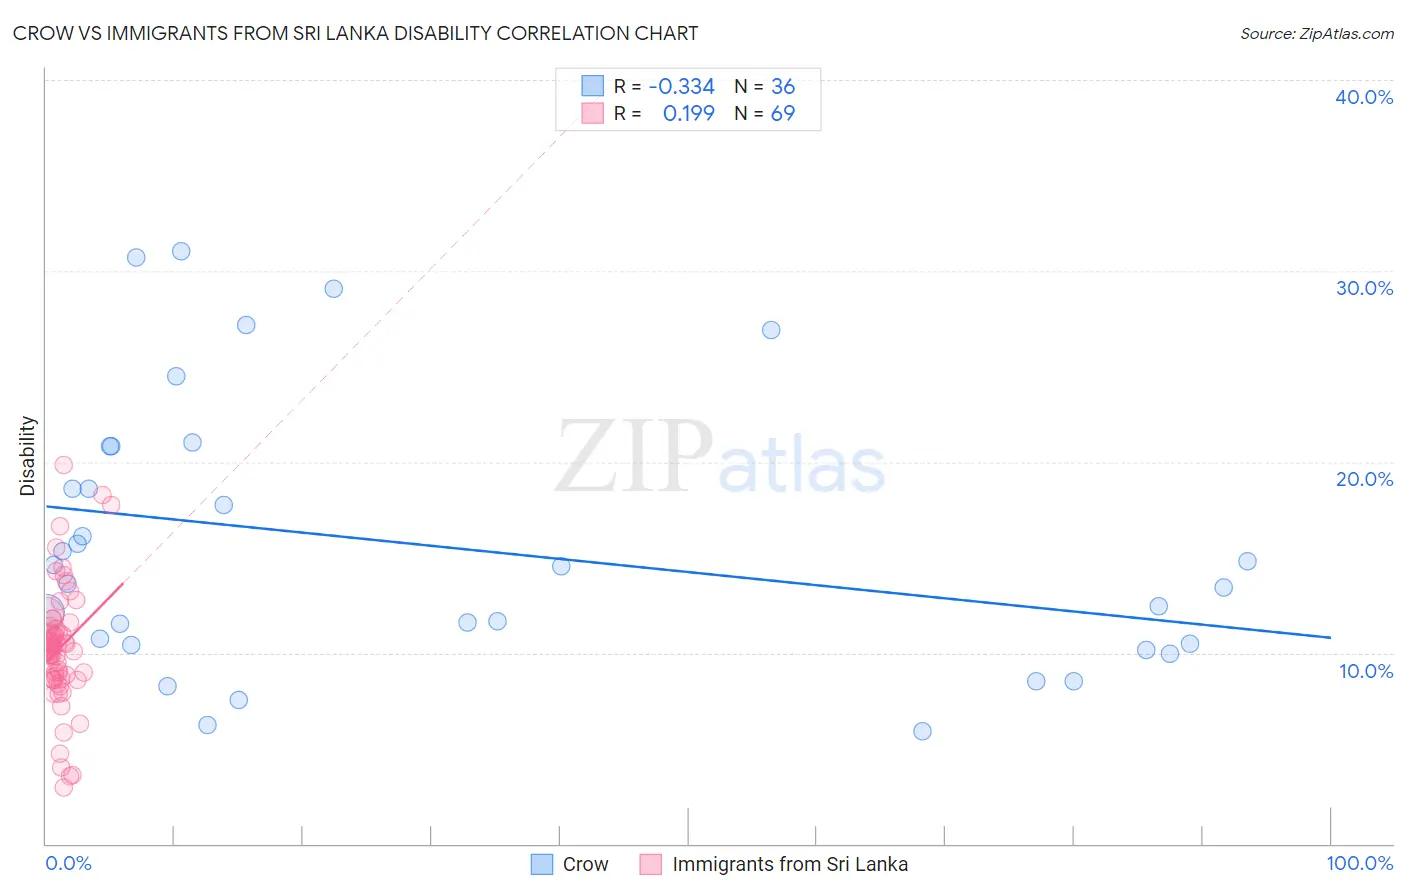
Crow vs Immigrants from Sri Lanka Disability Correlation Chart
The statistical analysis conducted on geographies consisting of 59,204,631 people shows a mild negative correlation between the proportion of Crow and percentage of population with a disability in the United States with a correlation coefficient (R) of -0.334 and weighted average of 12.9%. Similarly, the statistical analysis conducted on geographies consisting of 149,700,552 people shows a poor positive correlation between the proportion of Immigrants from Sri Lanka and percentage of population with a disability in the United States with a correlation coefficient (R) of 0.199 and weighted average of 10.5%, a difference of 23.5%.
Disability Correlation Summary
| Measurement | Crow | Immigrants from Sri Lanka |
| Minimum | 5.9% | 2.9% |
| Maximum | 31.1% | 19.8% |
| Range | 25.1% | 16.9% |
| Mean | 15.6% | 10.2% |
| Median | 14.1% | 10.2% |
| Interquartile 25% (IQ1) | 10.4% | 8.7% |
| Interquartile 75% (IQ3) | 19.7% | 11.3% |
| Interquartile Range (IQR) | 9.3% | 2.7% |
| Standard Deviation (Sample) | 7.0% | 3.2% |
| Standard Deviation (Population) | 6.9% | 3.2% |
Similar Demographics by Disability
Demographics Similar to Crow by Disability
In terms of disability, the demographic groups most similar to Crow are Welsh (12.9%, a difference of 0.010%), Irish (12.9%, a difference of 0.20%), Scottish (12.9%, a difference of 0.22%), Immigrants from Portugal (12.9%, a difference of 0.36%), and English (13.0%, a difference of 0.38%).
| Demographics | Rating | Rank | Disability |
| Germans | 0.0 /100 | #278 | Tragic 12.8% |
| Fijians | 0.0 /100 | #279 | Tragic 12.8% |
| Spanish | 0.0 /100 | #280 | Tragic 12.8% |
| Immigrants | Portugal | 0.0 /100 | #281 | Tragic 12.9% |
| Scottish | 0.0 /100 | #282 | Tragic 12.9% |
| Irish | 0.0 /100 | #283 | Tragic 12.9% |
| Welsh | 0.0 /100 | #284 | Tragic 12.9% |
| Crow | 0.0 /100 | #285 | Tragic 12.9% |
| English | 0.0 /100 | #286 | Tragic 13.0% |
| Africans | 0.0 /100 | #287 | Tragic 13.0% |
| Whites/Caucasians | 0.0 /100 | #288 | Tragic 13.0% |
| Slovaks | 0.0 /100 | #289 | Tragic 13.0% |
| Cheyenne | 0.0 /100 | #290 | Tragic 13.0% |
| Yaqui | 0.0 /100 | #291 | Tragic 13.1% |
| Aleuts | 0.0 /100 | #292 | Tragic 13.1% |
Demographics Similar to Immigrants from Sri Lanka by Disability
In terms of disability, the demographic groups most similar to Immigrants from Sri Lanka are Asian (10.4%, a difference of 0.10%), Immigrants from Venezuela (10.4%, a difference of 0.13%), Immigrants from Asia (10.5%, a difference of 0.69%), Immigrants from Pakistan (10.4%, a difference of 0.82%), and Burmese (10.4%, a difference of 0.83%).
| Demographics | Rating | Rank | Disability |
| Okinawans | 100.0 /100 | #15 | Exceptional 10.3% |
| Indians (Asian) | 100.0 /100 | #16 | Exceptional 10.3% |
| Immigrants | Iran | 100.0 /100 | #17 | Exceptional 10.3% |
| Burmese | 100.0 /100 | #18 | Exceptional 10.4% |
| Immigrants | Pakistan | 100.0 /100 | #19 | Exceptional 10.4% |
| Immigrants | Venezuela | 100.0 /100 | #20 | Exceptional 10.4% |
| Asians | 100.0 /100 | #21 | Exceptional 10.4% |
| Immigrants | Sri Lanka | 100.0 /100 | #22 | Exceptional 10.5% |
| Immigrants | Asia | 100.0 /100 | #23 | Exceptional 10.5% |
| Venezuelans | 100.0 /100 | #24 | Exceptional 10.5% |
| Immigrants | Malaysia | 100.0 /100 | #25 | Exceptional 10.6% |
| Argentineans | 100.0 /100 | #26 | Exceptional 10.6% |
| Cypriots | 100.0 /100 | #27 | Exceptional 10.6% |
| Egyptians | 100.0 /100 | #28 | Exceptional 10.6% |
| Immigrants | Argentina | 100.0 /100 | #29 | Exceptional 10.6% |