Crow vs Uruguayan Disability
COMPARE
Crow
Uruguayan
Disability
Disability Comparison
Crow
Uruguayans
12.9%
DISABILITY
0.0/ 100
METRIC RATING
285th/ 347
METRIC RANK
11.2%
DISABILITY
97.4/ 100
METRIC RATING
98th/ 347
METRIC RANK
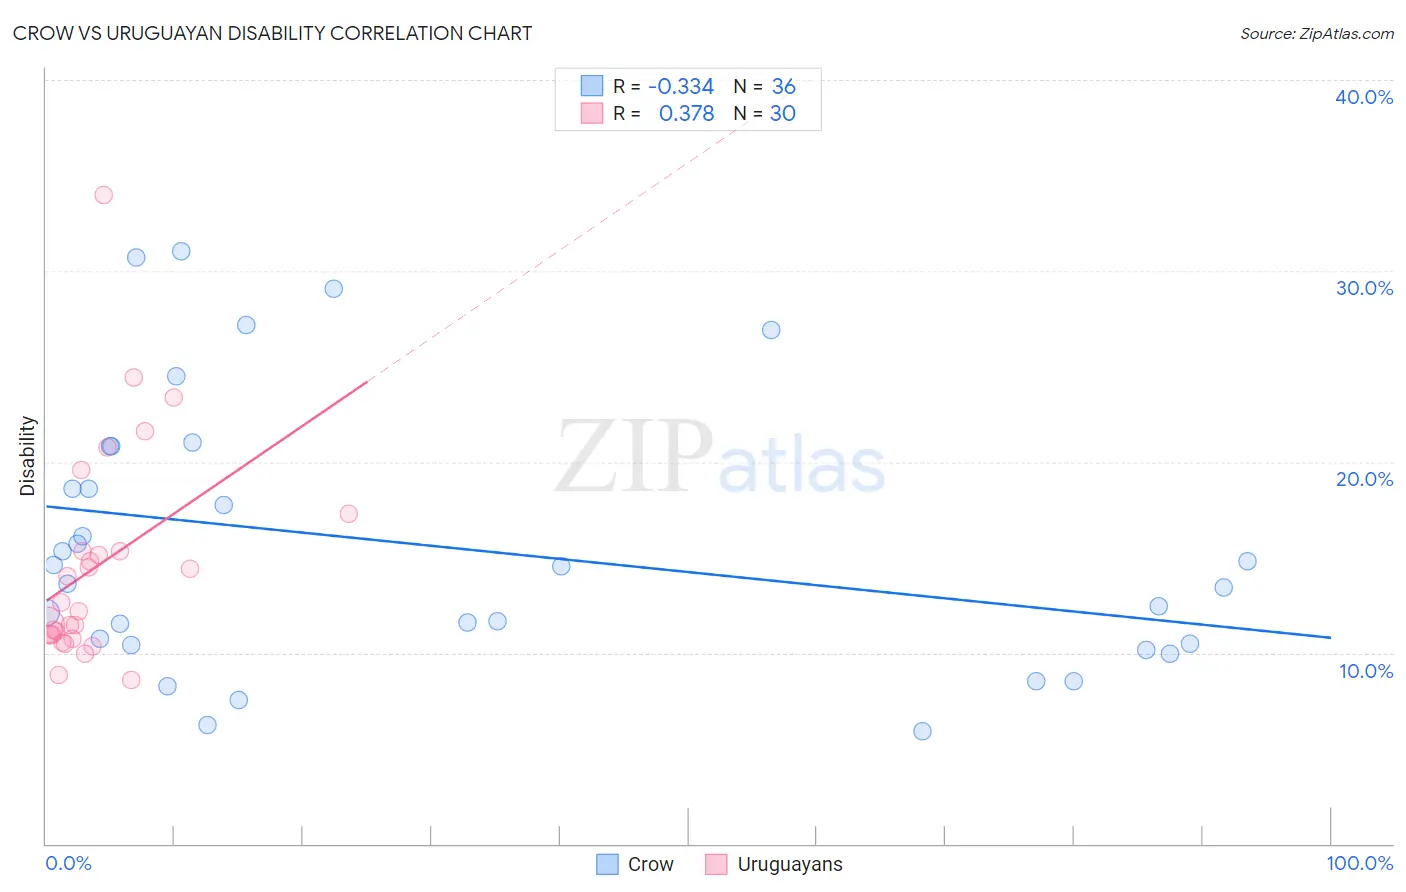
Crow vs Uruguayan Disability Correlation Chart
The statistical analysis conducted on geographies consisting of 59,204,631 people shows a mild negative correlation between the proportion of Crow and percentage of population with a disability in the United States with a correlation coefficient (R) of -0.334 and weighted average of 12.9%. Similarly, the statistical analysis conducted on geographies consisting of 144,784,951 people shows a mild positive correlation between the proportion of Uruguayans and percentage of population with a disability in the United States with a correlation coefficient (R) of 0.378 and weighted average of 11.2%, a difference of 14.9%.
Disability Correlation Summary
| Measurement | Crow | Uruguayan |
| Minimum | 5.9% | 8.6% |
| Maximum | 31.1% | 34.0% |
| Range | 25.1% | 25.4% |
| Mean | 15.6% | 14.6% |
| Median | 14.1% | 12.4% |
| Interquartile 25% (IQ1) | 10.4% | 10.9% |
| Interquartile 75% (IQ3) | 19.7% | 15.3% |
| Interquartile Range (IQR) | 9.3% | 4.4% |
| Standard Deviation (Sample) | 7.0% | 5.6% |
| Standard Deviation (Population) | 6.9% | 5.5% |
Similar Demographics by Disability
Demographics Similar to Crow by Disability
In terms of disability, the demographic groups most similar to Crow are Welsh (12.9%, a difference of 0.010%), Irish (12.9%, a difference of 0.20%), Scottish (12.9%, a difference of 0.22%), Immigrants from Portugal (12.9%, a difference of 0.36%), and English (13.0%, a difference of 0.38%).
| Demographics | Rating | Rank | Disability |
| Germans | 0.0 /100 | #278 | Tragic 12.8% |
| Fijians | 0.0 /100 | #279 | Tragic 12.8% |
| Spanish | 0.0 /100 | #280 | Tragic 12.8% |
| Immigrants | Portugal | 0.0 /100 | #281 | Tragic 12.9% |
| Scottish | 0.0 /100 | #282 | Tragic 12.9% |
| Irish | 0.0 /100 | #283 | Tragic 12.9% |
| Welsh | 0.0 /100 | #284 | Tragic 12.9% |
| Crow | 0.0 /100 | #285 | Tragic 12.9% |
| English | 0.0 /100 | #286 | Tragic 13.0% |
| Africans | 0.0 /100 | #287 | Tragic 13.0% |
| Whites/Caucasians | 0.0 /100 | #288 | Tragic 13.0% |
| Slovaks | 0.0 /100 | #289 | Tragic 13.0% |
| Cheyenne | 0.0 /100 | #290 | Tragic 13.0% |
| Yaqui | 0.0 /100 | #291 | Tragic 13.1% |
| Aleuts | 0.0 /100 | #292 | Tragic 13.1% |
Demographics Similar to Uruguayans by Disability
In terms of disability, the demographic groups most similar to Uruguayans are Bhutanese (11.2%, a difference of 0.0%), Immigrants from Czechoslovakia (11.2%, a difference of 0.010%), Immigrants from Zimbabwe (11.2%, a difference of 0.14%), Immigrants from Greece (11.3%, a difference of 0.18%), and Immigrants from Morocco (11.2%, a difference of 0.21%).
| Demographics | Rating | Rank | Disability |
| Immigrants | Western Asia | 98.1 /100 | #91 | Exceptional 11.2% |
| Ecuadorians | 98.0 /100 | #92 | Exceptional 11.2% |
| Immigrants | Ecuador | 98.0 /100 | #93 | Exceptional 11.2% |
| Immigrants | Morocco | 97.8 /100 | #94 | Exceptional 11.2% |
| Eastern Europeans | 97.8 /100 | #95 | Exceptional 11.2% |
| Immigrants | Zimbabwe | 97.7 /100 | #96 | Exceptional 11.2% |
| Bhutanese | 97.4 /100 | #97 | Exceptional 11.2% |
| Uruguayans | 97.4 /100 | #98 | Exceptional 11.2% |
| Immigrants | Czechoslovakia | 97.4 /100 | #99 | Exceptional 11.2% |
| Immigrants | Greece | 96.9 /100 | #100 | Exceptional 11.3% |
| Immigrants | Nicaragua | 96.8 /100 | #101 | Exceptional 11.3% |
| Immigrants | Eastern Africa | 96.7 /100 | #102 | Exceptional 11.3% |
| Immigrants | Uruguay | 96.4 /100 | #103 | Exceptional 11.3% |
| Immigrants | Immigrants | 96.4 /100 | #104 | Exceptional 11.3% |
| Immigrants | Kazakhstan | 96.4 /100 | #105 | Exceptional 11.3% |