Crow vs Bulgarian Disability
COMPARE
Crow
Bulgarian
Disability
Disability Comparison
Crow
Bulgarians
12.9%
DISABILITY
0.0/ 100
METRIC RATING
285th/ 347
METRIC RANK
11.0%
DISABILITY
99.6/ 100
METRIC RATING
65th/ 347
METRIC RANK
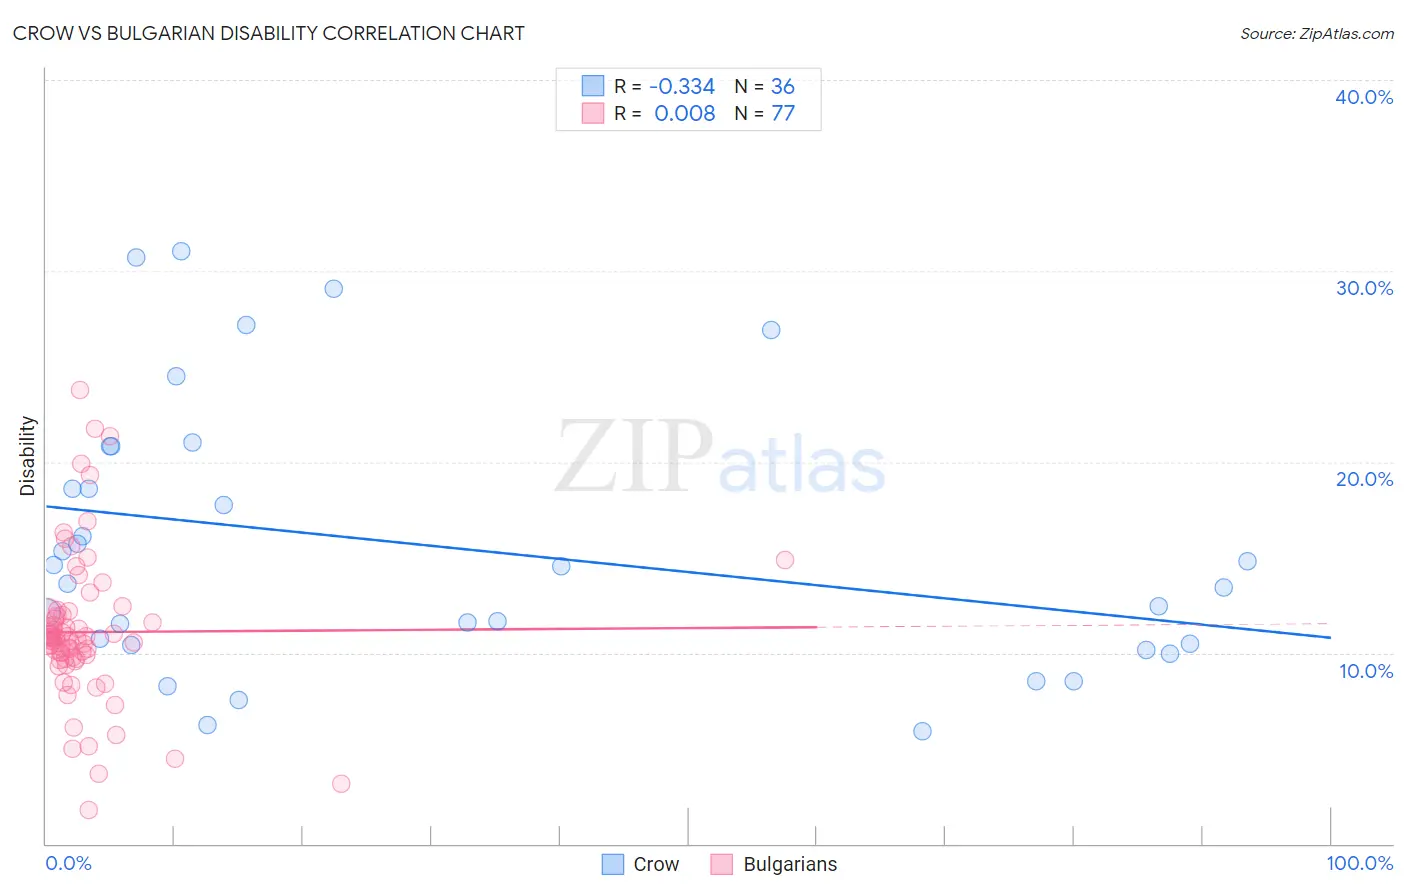
Crow vs Bulgarian Disability Correlation Chart
The statistical analysis conducted on geographies consisting of 59,204,631 people shows a mild negative correlation between the proportion of Crow and percentage of population with a disability in the United States with a correlation coefficient (R) of -0.334 and weighted average of 12.9%. Similarly, the statistical analysis conducted on geographies consisting of 205,630,627 people shows no correlation between the proportion of Bulgarians and percentage of population with a disability in the United States with a correlation coefficient (R) of 0.008 and weighted average of 11.0%, a difference of 17.6%.
Disability Correlation Summary
| Measurement | Crow | Bulgarian |
| Minimum | 5.9% | 1.8% |
| Maximum | 31.1% | 23.7% |
| Range | 25.1% | 21.9% |
| Mean | 15.6% | 11.1% |
| Median | 14.1% | 10.7% |
| Interquartile 25% (IQ1) | 10.4% | 9.7% |
| Interquartile 75% (IQ3) | 19.7% | 11.9% |
| Interquartile Range (IQR) | 9.3% | 2.3% |
| Standard Deviation (Sample) | 7.0% | 3.9% |
| Standard Deviation (Population) | 6.9% | 3.9% |
Similar Demographics by Disability
Demographics Similar to Crow by Disability
In terms of disability, the demographic groups most similar to Crow are Welsh (12.9%, a difference of 0.010%), Irish (12.9%, a difference of 0.20%), Scottish (12.9%, a difference of 0.22%), Immigrants from Portugal (12.9%, a difference of 0.36%), and English (13.0%, a difference of 0.38%).
| Demographics | Rating | Rank | Disability |
| Germans | 0.0 /100 | #278 | Tragic 12.8% |
| Fijians | 0.0 /100 | #279 | Tragic 12.8% |
| Spanish | 0.0 /100 | #280 | Tragic 12.8% |
| Immigrants | Portugal | 0.0 /100 | #281 | Tragic 12.9% |
| Scottish | 0.0 /100 | #282 | Tragic 12.9% |
| Irish | 0.0 /100 | #283 | Tragic 12.9% |
| Welsh | 0.0 /100 | #284 | Tragic 12.9% |
| Crow | 0.0 /100 | #285 | Tragic 12.9% |
| English | 0.0 /100 | #286 | Tragic 13.0% |
| Africans | 0.0 /100 | #287 | Tragic 13.0% |
| Whites/Caucasians | 0.0 /100 | #288 | Tragic 13.0% |
| Slovaks | 0.0 /100 | #289 | Tragic 13.0% |
| Cheyenne | 0.0 /100 | #290 | Tragic 13.0% |
| Yaqui | 0.0 /100 | #291 | Tragic 13.1% |
| Aleuts | 0.0 /100 | #292 | Tragic 13.1% |
Demographics Similar to Bulgarians by Disability
In terms of disability, the demographic groups most similar to Bulgarians are Laotian (11.0%, a difference of 0.010%), Immigrants from Sweden (11.0%, a difference of 0.020%), Colombian (11.0%, a difference of 0.10%), Immigrants from Eritrea (11.0%, a difference of 0.20%), and Immigrants from Northern Africa (10.9%, a difference of 0.22%).
| Demographics | Rating | Rank | Disability |
| Immigrants | South America | 99.8 /100 | #58 | Exceptional 10.9% |
| Immigrants | Colombia | 99.7 /100 | #59 | Exceptional 10.9% |
| Zimbabweans | 99.7 /100 | #60 | Exceptional 10.9% |
| Immigrants | Bulgaria | 99.7 /100 | #61 | Exceptional 10.9% |
| Immigrants | Northern Africa | 99.7 /100 | #62 | Exceptional 10.9% |
| Immigrants | Eritrea | 99.7 /100 | #63 | Exceptional 11.0% |
| Immigrants | Sweden | 99.6 /100 | #64 | Exceptional 11.0% |
| Bulgarians | 99.6 /100 | #65 | Exceptional 11.0% |
| Laotians | 99.6 /100 | #66 | Exceptional 11.0% |
| Colombians | 99.6 /100 | #67 | Exceptional 11.0% |
| Immigrants | Afghanistan | 99.6 /100 | #68 | Exceptional 11.0% |
| Sri Lankans | 99.5 /100 | #69 | Exceptional 11.0% |
| Immigrants | France | 99.4 /100 | #70 | Exceptional 11.0% |
| Immigrants | Lebanon | 99.4 /100 | #71 | Exceptional 11.0% |
| Immigrants | Chile | 99.4 /100 | #72 | Exceptional 11.0% |