Hopi vs Immigrants from Ghana Disability
COMPARE
Hopi
Immigrants from Ghana
Disability
Disability Comparison
Hopi
Immigrants from Ghana
13.2%
DISABILITY
0.0/ 100
METRIC RATING
297th/ 347
METRIC RANK
11.6%
DISABILITY
71.2/ 100
METRIC RATING
153rd/ 347
METRIC RANK
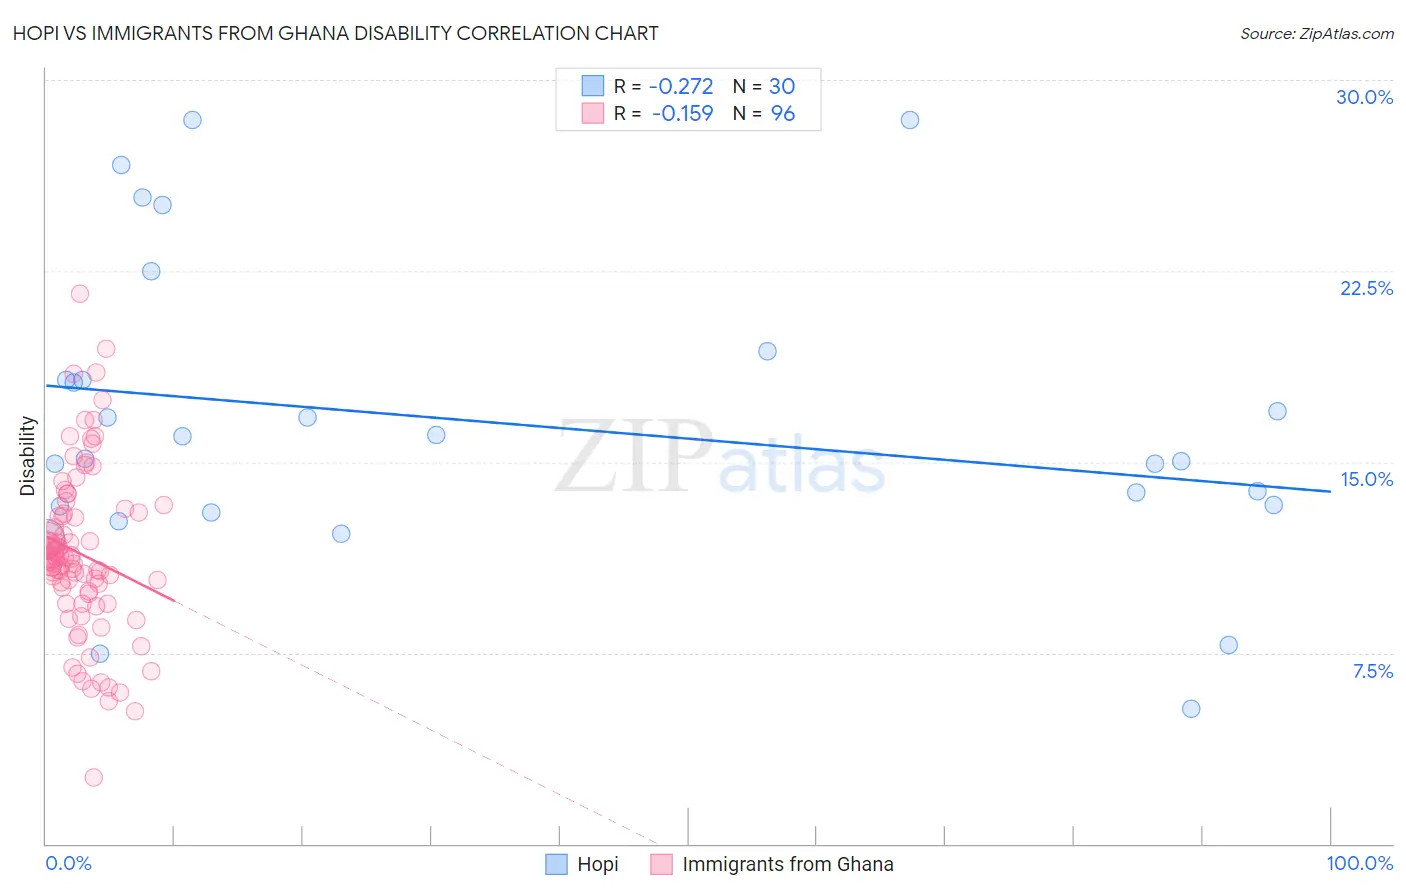
Hopi vs Immigrants from Ghana Disability Correlation Chart
The statistical analysis conducted on geographies consisting of 74,733,532 people shows a weak negative correlation between the proportion of Hopi and percentage of population with a disability in the United States with a correlation coefficient (R) of -0.272 and weighted average of 13.2%. Similarly, the statistical analysis conducted on geographies consisting of 199,930,208 people shows a poor negative correlation between the proportion of Immigrants from Ghana and percentage of population with a disability in the United States with a correlation coefficient (R) of -0.159 and weighted average of 11.6%, a difference of 13.7%.
Disability Correlation Summary
| Measurement | Hopi | Immigrants from Ghana |
| Minimum | 5.3% | 2.6% |
| Maximum | 28.4% | 21.6% |
| Range | 23.1% | 19.0% |
| Mean | 16.6% | 11.4% |
| Median | 15.6% | 11.2% |
| Interquartile 25% (IQ1) | 13.3% | 9.9% |
| Interquartile 75% (IQ3) | 18.2% | 13.0% |
| Interquartile Range (IQR) | 4.9% | 3.1% |
| Standard Deviation (Sample) | 5.8% | 3.3% |
| Standard Deviation (Population) | 5.7% | 3.3% |
Similar Demographics by Disability
Demographics Similar to Hopi by Disability
In terms of disability, the demographic groups most similar to Hopi are Alaska Native (13.2%, a difference of 0.010%), French (13.2%, a difference of 0.030%), Central American Indian (13.2%, a difference of 0.060%), Pennsylvania German (13.2%, a difference of 0.070%), and Nonimmigrants (13.2%, a difference of 0.10%).
| Demographics | Rating | Rank | Disability |
| Cheyenne | 0.0 /100 | #290 | Tragic 13.0% |
| Yaqui | 0.0 /100 | #291 | Tragic 13.1% |
| Aleuts | 0.0 /100 | #292 | Tragic 13.1% |
| Marshallese | 0.0 /100 | #293 | Tragic 13.1% |
| Celtics | 0.0 /100 | #294 | Tragic 13.1% |
| Immigrants | Nonimmigrants | 0.0 /100 | #295 | Tragic 13.2% |
| Central American Indians | 0.0 /100 | #296 | Tragic 13.2% |
| Hopi | 0.0 /100 | #297 | Tragic 13.2% |
| Alaska Natives | 0.0 /100 | #298 | Tragic 13.2% |
| French | 0.0 /100 | #299 | Tragic 13.2% |
| Pennsylvania Germans | 0.0 /100 | #300 | Tragic 13.2% |
| Immigrants | Micronesia | 0.0 /100 | #301 | Tragic 13.2% |
| Arapaho | 0.0 /100 | #302 | Tragic 13.2% |
| Scotch-Irish | 0.0 /100 | #303 | Tragic 13.3% |
| Yakama | 0.0 /100 | #304 | Tragic 13.4% |
Demographics Similar to Immigrants from Ghana by Disability
In terms of disability, the demographic groups most similar to Immigrants from Ghana are Immigrants from Guatemala (11.6%, a difference of 0.0%), Immigrants from Kenya (11.6%, a difference of 0.050%), Immigrants from Moldova (11.6%, a difference of 0.050%), Romanian (11.6%, a difference of 0.080%), and Immigrants from Netherlands (11.6%, a difference of 0.080%).
| Demographics | Rating | Rank | Disability |
| Immigrants | Hungary | 79.0 /100 | #146 | Good 11.5% |
| Immigrants | Ukraine | 77.6 /100 | #147 | Good 11.5% |
| Sudanese | 77.1 /100 | #148 | Good 11.5% |
| Immigrants | Norway | 73.2 /100 | #149 | Good 11.6% |
| Romanians | 72.7 /100 | #150 | Good 11.6% |
| Immigrants | Kenya | 72.1 /100 | #151 | Good 11.6% |
| Immigrants | Moldova | 72.0 /100 | #152 | Good 11.6% |
| Immigrants | Ghana | 71.2 /100 | #153 | Good 11.6% |
| Immigrants | Guatemala | 71.1 /100 | #154 | Good 11.6% |
| Immigrants | Netherlands | 69.8 /100 | #155 | Good 11.6% |
| Immigrants | Fiji | 69.5 /100 | #156 | Good 11.6% |
| Immigrants | Middle Africa | 69.5 /100 | #157 | Good 11.6% |
| Armenians | 65.9 /100 | #158 | Good 11.6% |
| Guatemalans | 65.1 /100 | #159 | Good 11.6% |
| Immigrants | Barbados | 64.2 /100 | #160 | Good 11.6% |