Immigrants from Japan vs Immigrants from Ghana Disability
COMPARE
Immigrants from Japan
Immigrants from Ghana
Disability
Disability Comparison
Immigrants from Japan
Immigrants from Ghana
10.8%
DISABILITY
99.9/ 100
METRIC RATING
44th/ 347
METRIC RANK
11.6%
DISABILITY
71.2/ 100
METRIC RATING
153rd/ 347
METRIC RANK
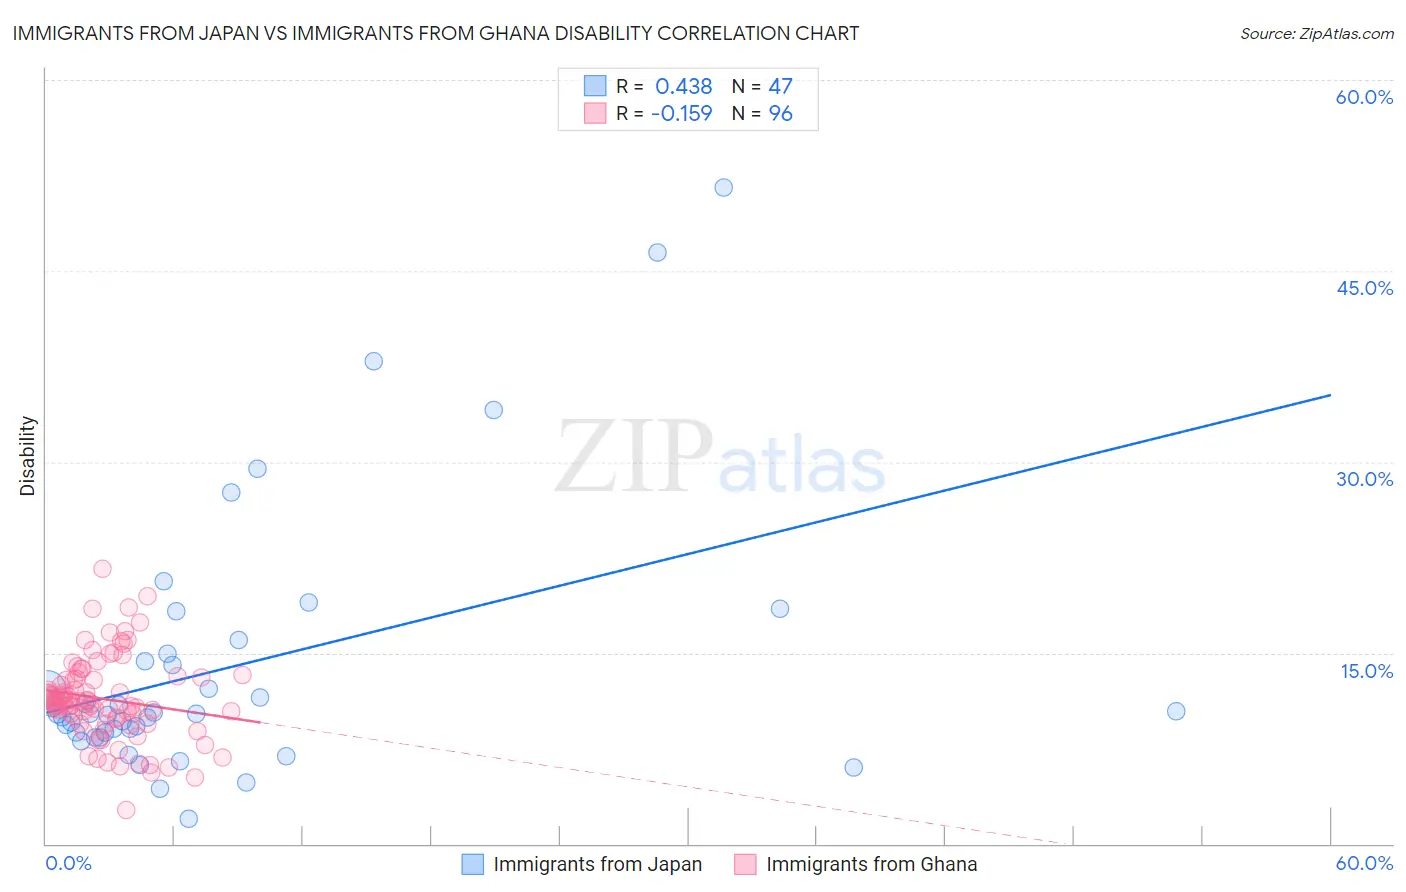
Immigrants from Japan vs Immigrants from Ghana Disability Correlation Chart
The statistical analysis conducted on geographies consisting of 340,149,948 people shows a moderate positive correlation between the proportion of Immigrants from Japan and percentage of population with a disability in the United States with a correlation coefficient (R) of 0.438 and weighted average of 10.8%. Similarly, the statistical analysis conducted on geographies consisting of 199,930,208 people shows a poor negative correlation between the proportion of Immigrants from Ghana and percentage of population with a disability in the United States with a correlation coefficient (R) of -0.159 and weighted average of 11.6%, a difference of 7.3%.
Disability Correlation Summary
| Measurement | Immigrants from Japan | Immigrants from Ghana |
| Minimum | 2.0% | 2.6% |
| Maximum | 51.5% | 21.6% |
| Range | 49.5% | 19.0% |
| Mean | 13.9% | 11.4% |
| Median | 10.2% | 11.2% |
| Interquartile 25% (IQ1) | 8.7% | 9.9% |
| Interquartile 75% (IQ3) | 14.9% | 13.0% |
| Interquartile Range (IQR) | 6.2% | 3.1% |
| Standard Deviation (Sample) | 10.5% | 3.3% |
| Standard Deviation (Population) | 10.3% | 3.3% |
Similar Demographics by Disability
Demographics Similar to Immigrants from Japan by Disability
In terms of disability, the demographic groups most similar to Immigrants from Japan are Israeli (10.8%, a difference of 0.10%), Immigrants from Nepal (10.8%, a difference of 0.15%), Immigrants from Australia (10.8%, a difference of 0.25%), Cambodian (10.8%, a difference of 0.29%), and Mongolian (10.8%, a difference of 0.29%).
| Demographics | Rating | Rank | Disability |
| Turks | 100.0 /100 | #37 | Exceptional 10.7% |
| Afghans | 99.9 /100 | #38 | Exceptional 10.8% |
| Cambodians | 99.9 /100 | #39 | Exceptional 10.8% |
| Mongolians | 99.9 /100 | #40 | Exceptional 10.8% |
| Immigrants | Australia | 99.9 /100 | #41 | Exceptional 10.8% |
| Immigrants | Nepal | 99.9 /100 | #42 | Exceptional 10.8% |
| Israelis | 99.9 /100 | #43 | Exceptional 10.8% |
| Immigrants | Japan | 99.9 /100 | #44 | Exceptional 10.8% |
| Immigrants | Peru | 99.9 /100 | #45 | Exceptional 10.8% |
| Tongans | 99.9 /100 | #46 | Exceptional 10.8% |
| Taiwanese | 99.9 /100 | #47 | Exceptional 10.8% |
| Soviet Union | 99.9 /100 | #48 | Exceptional 10.9% |
| Vietnamese | 99.9 /100 | #49 | Exceptional 10.9% |
| Immigrants | Saudi Arabia | 99.9 /100 | #50 | Exceptional 10.9% |
| Peruvians | 99.8 /100 | #51 | Exceptional 10.9% |
Demographics Similar to Immigrants from Ghana by Disability
In terms of disability, the demographic groups most similar to Immigrants from Ghana are Immigrants from Guatemala (11.6%, a difference of 0.0%), Immigrants from Kenya (11.6%, a difference of 0.050%), Immigrants from Moldova (11.6%, a difference of 0.050%), Romanian (11.6%, a difference of 0.080%), and Immigrants from Netherlands (11.6%, a difference of 0.080%).
| Demographics | Rating | Rank | Disability |
| Immigrants | Hungary | 79.0 /100 | #146 | Good 11.5% |
| Immigrants | Ukraine | 77.6 /100 | #147 | Good 11.5% |
| Sudanese | 77.1 /100 | #148 | Good 11.5% |
| Immigrants | Norway | 73.2 /100 | #149 | Good 11.6% |
| Romanians | 72.7 /100 | #150 | Good 11.6% |
| Immigrants | Kenya | 72.1 /100 | #151 | Good 11.6% |
| Immigrants | Moldova | 72.0 /100 | #152 | Good 11.6% |
| Immigrants | Ghana | 71.2 /100 | #153 | Good 11.6% |
| Immigrants | Guatemala | 71.1 /100 | #154 | Good 11.6% |
| Immigrants | Netherlands | 69.8 /100 | #155 | Good 11.6% |
| Immigrants | Fiji | 69.5 /100 | #156 | Good 11.6% |
| Immigrants | Middle Africa | 69.5 /100 | #157 | Good 11.6% |
| Armenians | 65.9 /100 | #158 | Good 11.6% |
| Guatemalans | 65.1 /100 | #159 | Good 11.6% |
| Immigrants | Barbados | 64.2 /100 | #160 | Good 11.6% |