Croatian vs Immigrants from Ghana Disability
COMPARE
Croatian
Immigrants from Ghana
Disability
Disability Comparison
Croatians
Immigrants from Ghana
12.1%
DISABILITY
4.9/ 100
METRIC RATING
219th/ 347
METRIC RANK
11.6%
DISABILITY
71.2/ 100
METRIC RATING
153rd/ 347
METRIC RANK
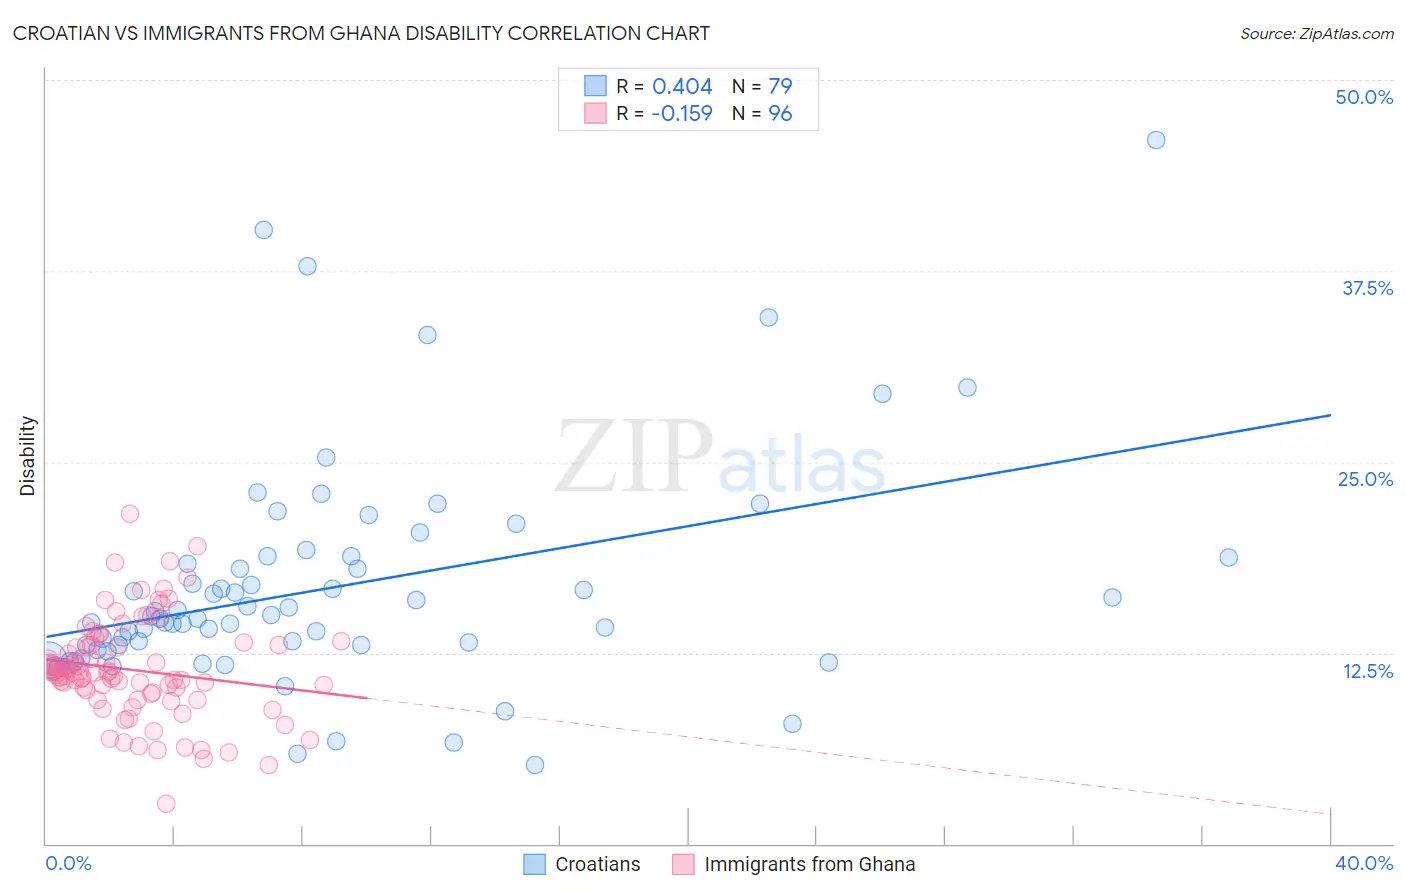
Croatian vs Immigrants from Ghana Disability Correlation Chart
The statistical analysis conducted on geographies consisting of 375,710,969 people shows a moderate positive correlation between the proportion of Croatians and percentage of population with a disability in the United States with a correlation coefficient (R) of 0.404 and weighted average of 12.1%. Similarly, the statistical analysis conducted on geographies consisting of 199,930,208 people shows a poor negative correlation between the proportion of Immigrants from Ghana and percentage of population with a disability in the United States with a correlation coefficient (R) of -0.159 and weighted average of 11.6%, a difference of 4.3%.
Disability Correlation Summary
| Measurement | Croatian | Immigrants from Ghana |
| Minimum | 5.2% | 2.6% |
| Maximum | 46.0% | 21.6% |
| Range | 40.9% | 19.0% |
| Mean | 16.7% | 11.4% |
| Median | 14.7% | 11.2% |
| Interquartile 25% (IQ1) | 12.7% | 9.9% |
| Interquartile 75% (IQ3) | 18.8% | 13.0% |
| Interquartile Range (IQR) | 6.1% | 3.1% |
| Standard Deviation (Sample) | 7.4% | 3.3% |
| Standard Deviation (Population) | 7.3% | 3.3% |
Similar Demographics by Disability
Demographics Similar to Croatians by Disability
In terms of disability, the demographic groups most similar to Croatians are Immigrants from Jamaica (12.1%, a difference of 0.040%), Immigrants from Bahamas (12.1%, a difference of 0.040%), Panamanian (12.1%, a difference of 0.11%), Immigrants from North America (12.1%, a difference of 0.11%), and Northern European (12.1%, a difference of 0.16%).
| Demographics | Rating | Rank | Disability |
| Austrians | 7.2 /100 | #212 | Tragic 12.0% |
| Immigrants | Iraq | 7.1 /100 | #213 | Tragic 12.0% |
| Immigrants | Somalia | 6.8 /100 | #214 | Tragic 12.0% |
| Immigrants | Canada | 6.1 /100 | #215 | Tragic 12.1% |
| Panamanians | 5.4 /100 | #216 | Tragic 12.1% |
| Immigrants | North America | 5.3 /100 | #217 | Tragic 12.1% |
| Immigrants | Jamaica | 5.0 /100 | #218 | Tragic 12.1% |
| Croatians | 4.9 /100 | #219 | Tragic 12.1% |
| Immigrants | Bahamas | 4.7 /100 | #220 | Tragic 12.1% |
| Northern Europeans | 4.2 /100 | #221 | Tragic 12.1% |
| Spanish American Indians | 4.1 /100 | #222 | Tragic 12.1% |
| Hispanics or Latinos | 3.9 /100 | #223 | Tragic 12.1% |
| Mexicans | 3.7 /100 | #224 | Tragic 12.1% |
| Senegalese | 3.5 /100 | #225 | Tragic 12.1% |
| Jamaicans | 3.3 /100 | #226 | Tragic 12.1% |
Demographics Similar to Immigrants from Ghana by Disability
In terms of disability, the demographic groups most similar to Immigrants from Ghana are Immigrants from Guatemala (11.6%, a difference of 0.0%), Immigrants from Kenya (11.6%, a difference of 0.050%), Immigrants from Moldova (11.6%, a difference of 0.050%), Romanian (11.6%, a difference of 0.080%), and Immigrants from Netherlands (11.6%, a difference of 0.080%).
| Demographics | Rating | Rank | Disability |
| Immigrants | Hungary | 79.0 /100 | #146 | Good 11.5% |
| Immigrants | Ukraine | 77.6 /100 | #147 | Good 11.5% |
| Sudanese | 77.1 /100 | #148 | Good 11.5% |
| Immigrants | Norway | 73.2 /100 | #149 | Good 11.6% |
| Romanians | 72.7 /100 | #150 | Good 11.6% |
| Immigrants | Kenya | 72.1 /100 | #151 | Good 11.6% |
| Immigrants | Moldova | 72.0 /100 | #152 | Good 11.6% |
| Immigrants | Ghana | 71.2 /100 | #153 | Good 11.6% |
| Immigrants | Guatemala | 71.1 /100 | #154 | Good 11.6% |
| Immigrants | Netherlands | 69.8 /100 | #155 | Good 11.6% |
| Immigrants | Fiji | 69.5 /100 | #156 | Good 11.6% |
| Immigrants | Middle Africa | 69.5 /100 | #157 | Good 11.6% |
| Armenians | 65.9 /100 | #158 | Good 11.6% |
| Guatemalans | 65.1 /100 | #159 | Good 11.6% |
| Immigrants | Barbados | 64.2 /100 | #160 | Good 11.6% |