British West Indian vs Immigrants from Australia Self-Care Disability
COMPARE
British West Indian
Immigrants from Australia
Self-Care Disability
Self-Care Disability Comparison
British West Indians
Immigrants from Australia
2.8%
SELF-CARE DISABILITY
0.0/ 100
METRIC RATING
310th/ 347
METRIC RANK
2.3%
SELF-CARE DISABILITY
99.9/ 100
METRIC RATING
35th/ 347
METRIC RANK
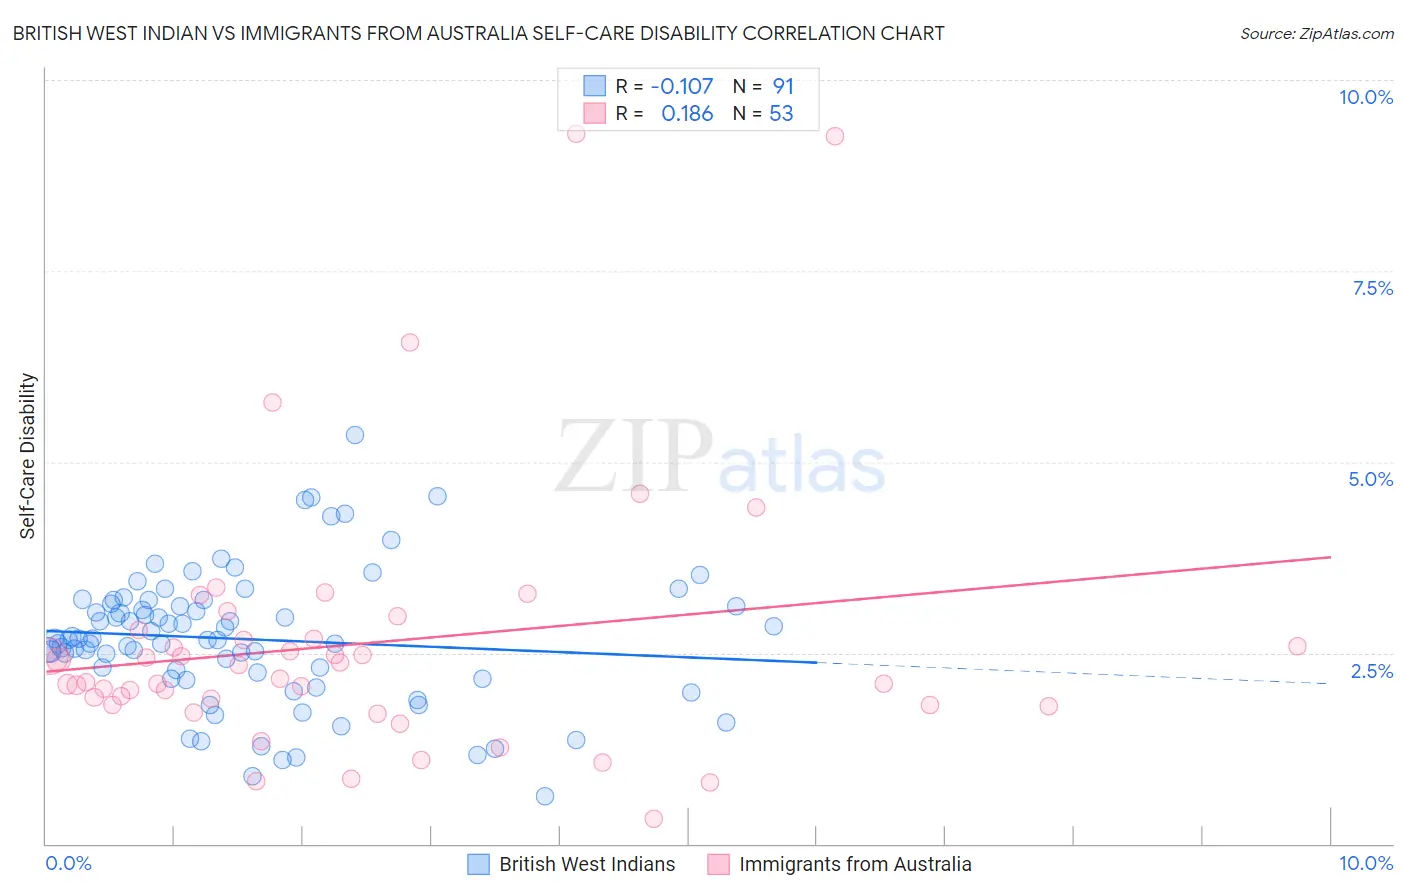
British West Indian vs Immigrants from Australia Self-Care Disability Correlation Chart
The statistical analysis conducted on geographies consisting of 152,617,328 people shows a poor negative correlation between the proportion of British West Indians and percentage of population with self-care disability in the United States with a correlation coefficient (R) of -0.107 and weighted average of 2.8%. Similarly, the statistical analysis conducted on geographies consisting of 227,025,526 people shows a poor positive correlation between the proportion of Immigrants from Australia and percentage of population with self-care disability in the United States with a correlation coefficient (R) of 0.186 and weighted average of 2.3%, a difference of 24.4%.
Self-Care Disability Correlation Summary
| Measurement | British West Indian | Immigrants from Australia |
| Minimum | 0.62% | 0.32% |
| Maximum | 5.4% | 9.3% |
| Range | 4.7% | 9.0% |
| Mean | 2.7% | 2.6% |
| Median | 2.7% | 2.2% |
| Interquartile 25% (IQ1) | 2.2% | 1.8% |
| Interquartile 75% (IQ3) | 3.1% | 2.7% |
| Interquartile Range (IQR) | 0.97% | 0.93% |
| Standard Deviation (Sample) | 0.87% | 1.7% |
| Standard Deviation (Population) | 0.86% | 1.7% |
Similar Demographics by Self-Care Disability
Demographics Similar to British West Indians by Self-Care Disability
In terms of self-care disability, the demographic groups most similar to British West Indians are Puget Sound Salish (2.8%, a difference of 0.070%), Bangladeshi (2.8%, a difference of 0.10%), Immigrants from Grenada (2.8%, a difference of 0.25%), Immigrants from Caribbean (2.8%, a difference of 0.26%), and Spanish American (2.8%, a difference of 0.30%).
| Demographics | Rating | Rank | Self-Care Disability |
| Immigrants | Belize | 0.0 /100 | #303 | Tragic 2.8% |
| Cree | 0.0 /100 | #304 | Tragic 2.8% |
| Immigrants | West Indies | 0.0 /100 | #305 | Tragic 2.8% |
| Aleuts | 0.0 /100 | #306 | Tragic 2.8% |
| Natives/Alaskans | 0.0 /100 | #307 | Tragic 2.8% |
| Immigrants | Grenada | 0.0 /100 | #308 | Tragic 2.8% |
| Bangladeshis | 0.0 /100 | #309 | Tragic 2.8% |
| British West Indians | 0.0 /100 | #310 | Tragic 2.8% |
| Puget Sound Salish | 0.0 /100 | #311 | Tragic 2.8% |
| Immigrants | Caribbean | 0.0 /100 | #312 | Tragic 2.8% |
| Spanish Americans | 0.0 /100 | #313 | Tragic 2.8% |
| Creek | 0.0 /100 | #314 | Tragic 2.8% |
| Immigrants | Cuba | 0.0 /100 | #315 | Tragic 2.8% |
| Menominee | 0.0 /100 | #316 | Tragic 2.8% |
| Immigrants | Dominica | 0.0 /100 | #317 | Tragic 2.8% |
Demographics Similar to Immigrants from Australia by Self-Care Disability
In terms of self-care disability, the demographic groups most similar to Immigrants from Australia are Immigrants from Lithuania (2.3%, a difference of 0.010%), Immigrants from Turkey (2.3%, a difference of 0.060%), Immigrants from Korea (2.3%, a difference of 0.12%), Immigrants from Sweden (2.3%, a difference of 0.18%), and Immigrants from Eastern Africa (2.3%, a difference of 0.31%).
| Demographics | Rating | Rank | Self-Care Disability |
| Inupiat | 99.9 /100 | #28 | Exceptional 2.2% |
| Immigrants | Zimbabwe | 99.9 /100 | #29 | Exceptional 2.3% |
| Paraguayans | 99.9 /100 | #30 | Exceptional 2.3% |
| Danes | 99.9 /100 | #31 | Exceptional 2.3% |
| Burmese | 99.9 /100 | #32 | Exceptional 2.3% |
| Immigrants | Korea | 99.9 /100 | #33 | Exceptional 2.3% |
| Immigrants | Turkey | 99.9 /100 | #34 | Exceptional 2.3% |
| Immigrants | Australia | 99.9 /100 | #35 | Exceptional 2.3% |
| Immigrants | Lithuania | 99.9 /100 | #36 | Exceptional 2.3% |
| Immigrants | Sweden | 99.9 /100 | #37 | Exceptional 2.3% |
| Immigrants | Eastern Africa | 99.9 /100 | #38 | Exceptional 2.3% |
| Immigrants | Bulgaria | 99.8 /100 | #39 | Exceptional 2.3% |
| Iranians | 99.8 /100 | #40 | Exceptional 2.3% |
| Immigrants | Sudan | 99.8 /100 | #41 | Exceptional 2.3% |
| Immigrants | Uganda | 99.8 /100 | #42 | Exceptional 2.3% |