Cree vs Immigrants from Armenia Hearing Disability
COMPARE
Cree
Immigrants from Armenia
Hearing Disability
Hearing Disability Comparison
Cree
Immigrants from Armenia
3.8%
HEARING DISABILITY
0.0/ 100
METRIC RATING
310th/ 347
METRIC RANK
2.7%
HEARING DISABILITY
97.2/ 100
METRIC RATING
82nd/ 347
METRIC RANK
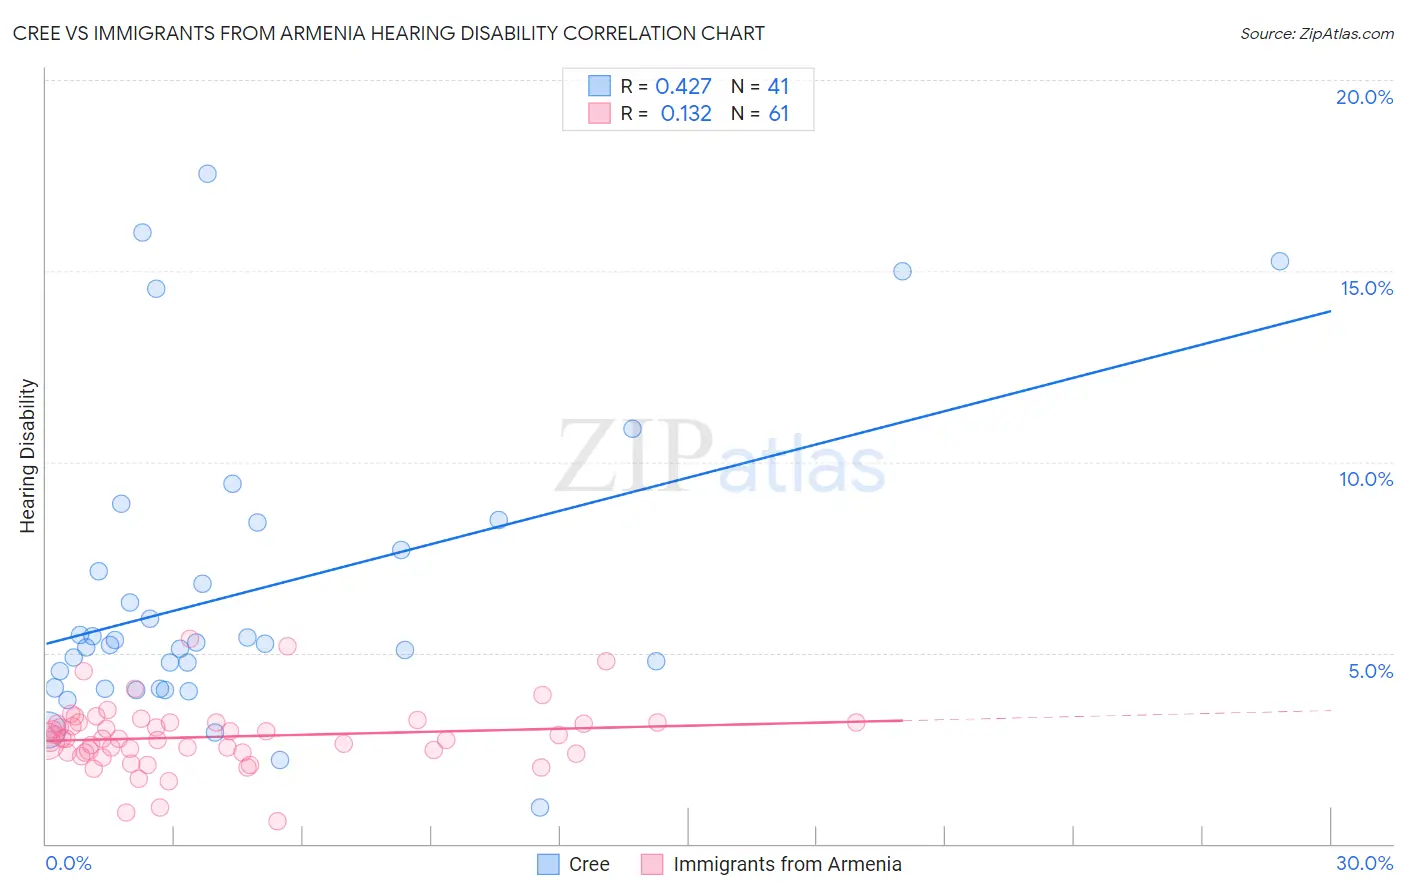
Cree vs Immigrants from Armenia Hearing Disability Correlation Chart
The statistical analysis conducted on geographies consisting of 76,207,567 people shows a moderate positive correlation between the proportion of Cree and percentage of population with hearing disability in the United States with a correlation coefficient (R) of 0.427 and weighted average of 3.8%. Similarly, the statistical analysis conducted on geographies consisting of 97,707,768 people shows a poor positive correlation between the proportion of Immigrants from Armenia and percentage of population with hearing disability in the United States with a correlation coefficient (R) of 0.132 and weighted average of 2.7%, a difference of 40.0%.
Hearing Disability Correlation Summary
| Measurement | Cree | Immigrants from Armenia |
| Minimum | 0.96% | 0.60% |
| Maximum | 17.6% | 5.4% |
| Range | 16.6% | 4.8% |
| Mean | 6.6% | 2.8% |
| Median | 5.2% | 2.8% |
| Interquartile 25% (IQ1) | 4.1% | 2.4% |
| Interquartile 75% (IQ3) | 8.0% | 3.2% |
| Interquartile Range (IQR) | 4.0% | 0.77% |
| Standard Deviation (Sample) | 3.9% | 0.87% |
| Standard Deviation (Population) | 3.9% | 0.86% |
Similar Demographics by Hearing Disability
Demographics Similar to Cree by Hearing Disability
In terms of hearing disability, the demographic groups most similar to Cree are Scotch-Irish (3.8%, a difference of 0.31%), Ottawa (3.8%, a difference of 0.39%), French Canadian (3.8%, a difference of 0.83%), Marshallese (3.8%, a difference of 0.95%), and American (3.9%, a difference of 1.3%).
| Demographics | Rating | Rank | Hearing Disability |
| Menominee | 0.0 /100 | #303 | Tragic 3.7% |
| French | 0.0 /100 | #304 | Tragic 3.8% |
| English | 0.0 /100 | #305 | Tragic 3.8% |
| Marshallese | 0.0 /100 | #306 | Tragic 3.8% |
| French Canadians | 0.0 /100 | #307 | Tragic 3.8% |
| Ottawa | 0.0 /100 | #308 | Tragic 3.8% |
| Scotch-Irish | 0.0 /100 | #309 | Tragic 3.8% |
| Cree | 0.0 /100 | #310 | Tragic 3.8% |
| Americans | 0.0 /100 | #311 | Tragic 3.9% |
| Cajuns | 0.0 /100 | #312 | Tragic 3.9% |
| Hopi | 0.0 /100 | #313 | Tragic 3.9% |
| Yakama | 0.0 /100 | #314 | Tragic 3.9% |
| Puget Sound Salish | 0.0 /100 | #315 | Tragic 3.9% |
| Spanish Americans | 0.0 /100 | #316 | Tragic 4.0% |
| Comanche | 0.0 /100 | #317 | Tragic 4.0% |
Demographics Similar to Immigrants from Armenia by Hearing Disability
In terms of hearing disability, the demographic groups most similar to Immigrants from Armenia are Immigrants from Uruguay (2.7%, a difference of 0.020%), Immigrants from Cuba (2.7%, a difference of 0.020%), Immigrants from Asia (2.7%, a difference of 0.050%), Immigrants from Argentina (2.8%, a difference of 0.21%), and Colombian (2.7%, a difference of 0.23%).
| Demographics | Rating | Rank | Hearing Disability |
| Immigrants | Saudi Arabia | 97.5 /100 | #75 | Exceptional 2.7% |
| Asians | 97.5 /100 | #76 | Exceptional 2.7% |
| Immigrants | Malaysia | 97.5 /100 | #77 | Exceptional 2.7% |
| Mongolians | 97.4 /100 | #78 | Exceptional 2.7% |
| Colombians | 97.4 /100 | #79 | Exceptional 2.7% |
| Immigrants | Asia | 97.2 /100 | #80 | Exceptional 2.7% |
| Immigrants | Uruguay | 97.2 /100 | #81 | Exceptional 2.7% |
| Immigrants | Armenia | 97.2 /100 | #82 | Exceptional 2.7% |
| Immigrants | Cuba | 97.2 /100 | #83 | Exceptional 2.7% |
| Immigrants | Argentina | 97.0 /100 | #84 | Exceptional 2.8% |
| Immigrants | Northern Africa | 96.9 /100 | #85 | Exceptional 2.8% |
| Immigrants | Iran | 96.8 /100 | #86 | Exceptional 2.8% |
| Somalis | 96.7 /100 | #87 | Exceptional 2.8% |
| Immigrants | Turkey | 96.7 /100 | #88 | Exceptional 2.8% |
| Belizeans | 96.6 /100 | #89 | Exceptional 2.8% |