Assyrian/Chaldean/Syriac vs Immigrants from Ecuador Hearing Disability
COMPARE
Assyrian/Chaldean/Syriac
Immigrants from Ecuador
Hearing Disability
Hearing Disability Comparison
Assyrians/Chaldeans/Syriacs
Immigrants from Ecuador
3.3%
HEARING DISABILITY
0.9/ 100
METRIC RATING
244th/ 347
METRIC RANK
2.5%
HEARING DISABILITY
99.9/ 100
METRIC RATING
10th/ 347
METRIC RANK
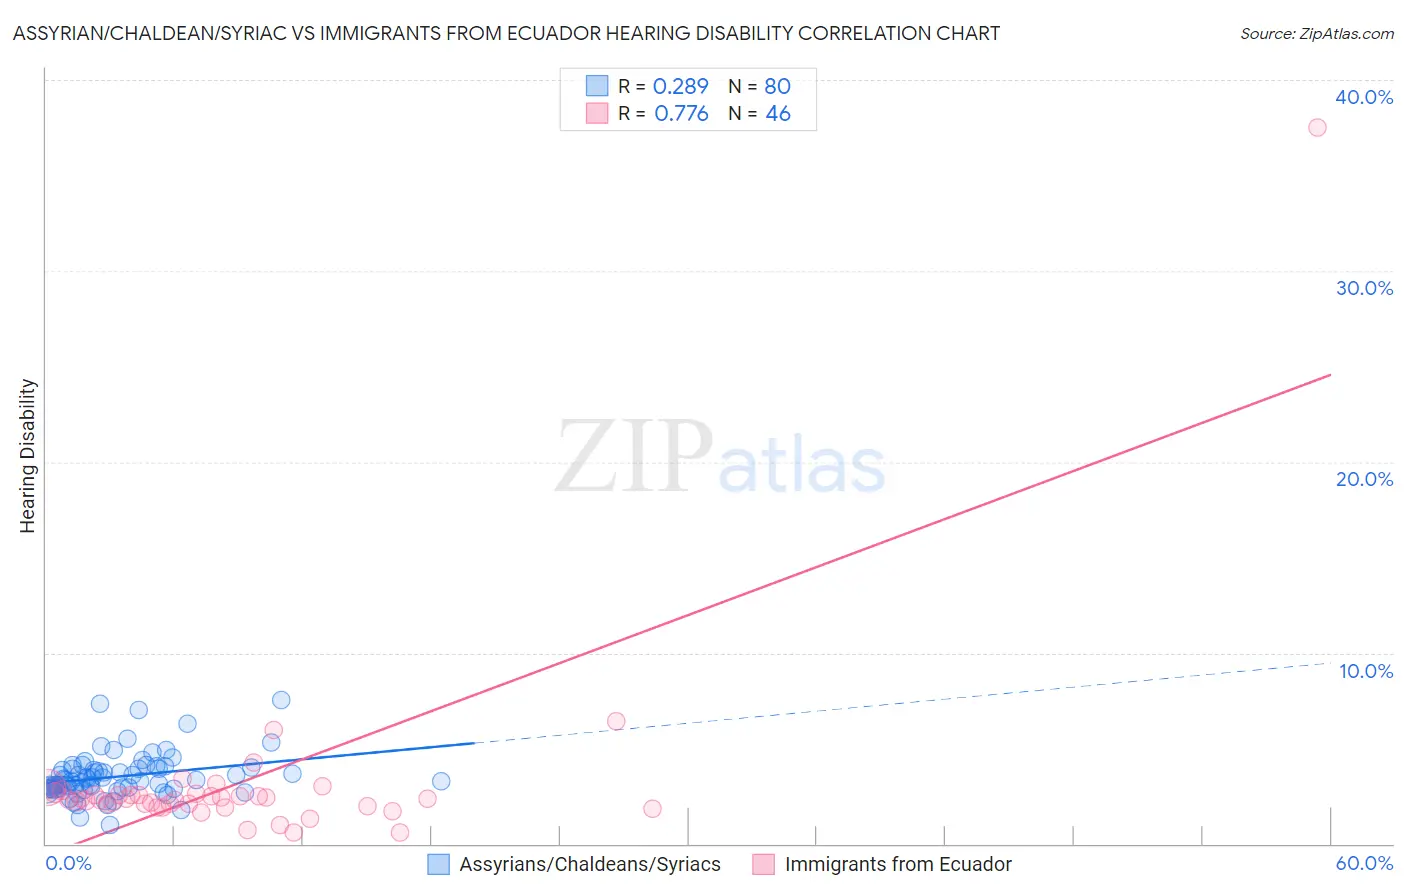
Assyrian/Chaldean/Syriac vs Immigrants from Ecuador Hearing Disability Correlation Chart
The statistical analysis conducted on geographies consisting of 110,312,508 people shows a weak positive correlation between the proportion of Assyrians/Chaldeans/Syriacs and percentage of population with hearing disability in the United States with a correlation coefficient (R) of 0.289 and weighted average of 3.3%. Similarly, the statistical analysis conducted on geographies consisting of 270,917,145 people shows a strong positive correlation between the proportion of Immigrants from Ecuador and percentage of population with hearing disability in the United States with a correlation coefficient (R) of 0.776 and weighted average of 2.5%, a difference of 34.3%.
Hearing Disability Correlation Summary
| Measurement | Assyrian/Chaldean/Syriac | Immigrants from Ecuador |
| Minimum | 0.96% | 0.57% |
| Maximum | 7.5% | 37.5% |
| Range | 6.6% | 36.9% |
| Mean | 3.5% | 3.2% |
| Median | 3.3% | 2.3% |
| Interquartile 25% (IQ1) | 2.9% | 2.0% |
| Interquartile 75% (IQ3) | 3.9% | 2.6% |
| Interquartile Range (IQR) | 1.0% | 0.59% |
| Standard Deviation (Sample) | 1.2% | 5.3% |
| Standard Deviation (Population) | 1.2% | 5.2% |
Similar Demographics by Hearing Disability
Demographics Similar to Assyrians/Chaldeans/Syriacs by Hearing Disability
In terms of hearing disability, the demographic groups most similar to Assyrians/Chaldeans/Syriacs are Immigrants from Western Europe (3.3%, a difference of 0.070%), Yugoslavian (3.3%, a difference of 0.24%), Immigrants from Scotland (3.3%, a difference of 0.34%), Samoan (3.3%, a difference of 0.35%), and Immigrants from Netherlands (3.3%, a difference of 0.43%).
| Demographics | Rating | Rank | Hearing Disability |
| Immigrants | Austria | 1.8 /100 | #237 | Tragic 3.3% |
| German Russians | 1.8 /100 | #238 | Tragic 3.3% |
| Nepalese | 1.2 /100 | #239 | Tragic 3.3% |
| Immigrants | Netherlands | 1.1 /100 | #240 | Tragic 3.3% |
| Samoans | 1.1 /100 | #241 | Tragic 3.3% |
| Yugoslavians | 1.0 /100 | #242 | Tragic 3.3% |
| Immigrants | Western Europe | 1.0 /100 | #243 | Tragic 3.3% |
| Assyrians/Chaldeans/Syriacs | 0.9 /100 | #244 | Tragic 3.3% |
| Immigrants | Scotland | 0.8 /100 | #245 | Tragic 3.3% |
| Immigrants | England | 0.7 /100 | #246 | Tragic 3.3% |
| Lithuanians | 0.6 /100 | #247 | Tragic 3.4% |
| Austrians | 0.6 /100 | #248 | Tragic 3.4% |
| Italians | 0.4 /100 | #249 | Tragic 3.4% |
| Yuman | 0.4 /100 | #250 | Tragic 3.4% |
| Hungarians | 0.4 /100 | #251 | Tragic 3.4% |
Demographics Similar to Immigrants from Ecuador by Hearing Disability
In terms of hearing disability, the demographic groups most similar to Immigrants from Ecuador are Immigrants from Trinidad and Tobago (2.5%, a difference of 0.55%), Trinidadian and Tobagonian (2.5%, a difference of 0.86%), Immigrants from Dominican Republic (2.4%, a difference of 1.0%), Sierra Leonean (2.5%, a difference of 1.1%), and Ecuadorian (2.5%, a difference of 1.4%).
| Demographics | Rating | Rank | Hearing Disability |
| Guyanese | 100.0 /100 | #3 | Exceptional 2.3% |
| Immigrants | Guyana | 100.0 /100 | #4 | Exceptional 2.3% |
| Immigrants | Barbados | 100.0 /100 | #5 | Exceptional 2.4% |
| Vietnamese | 100.0 /100 | #6 | Exceptional 2.4% |
| Immigrants | Bangladesh | 100.0 /100 | #7 | Exceptional 2.4% |
| British West Indians | 100.0 /100 | #8 | Exceptional 2.4% |
| Immigrants | Dominican Republic | 100.0 /100 | #9 | Exceptional 2.4% |
| Immigrants | Ecuador | 99.9 /100 | #10 | Exceptional 2.5% |
| Immigrants | Trinidad and Tobago | 99.9 /100 | #11 | Exceptional 2.5% |
| Trinidadians and Tobagonians | 99.9 /100 | #12 | Exceptional 2.5% |
| Sierra Leoneans | 99.9 /100 | #13 | Exceptional 2.5% |
| Ecuadorians | 99.9 /100 | #14 | Exceptional 2.5% |
| Barbadians | 99.9 /100 | #15 | Exceptional 2.5% |
| Immigrants | West Indies | 99.9 /100 | #16 | Exceptional 2.5% |
| Immigrants | India | 99.9 /100 | #17 | Exceptional 2.5% |