Mexican American Indian vs Immigrants from Ecuador Hearing Disability
COMPARE
Mexican American Indian
Immigrants from Ecuador
Hearing Disability
Hearing Disability Comparison
Mexican American Indians
Immigrants from Ecuador
3.0%
HEARING DISABILITY
34.7/ 100
METRIC RATING
188th/ 347
METRIC RANK
2.5%
HEARING DISABILITY
99.9/ 100
METRIC RATING
10th/ 347
METRIC RANK
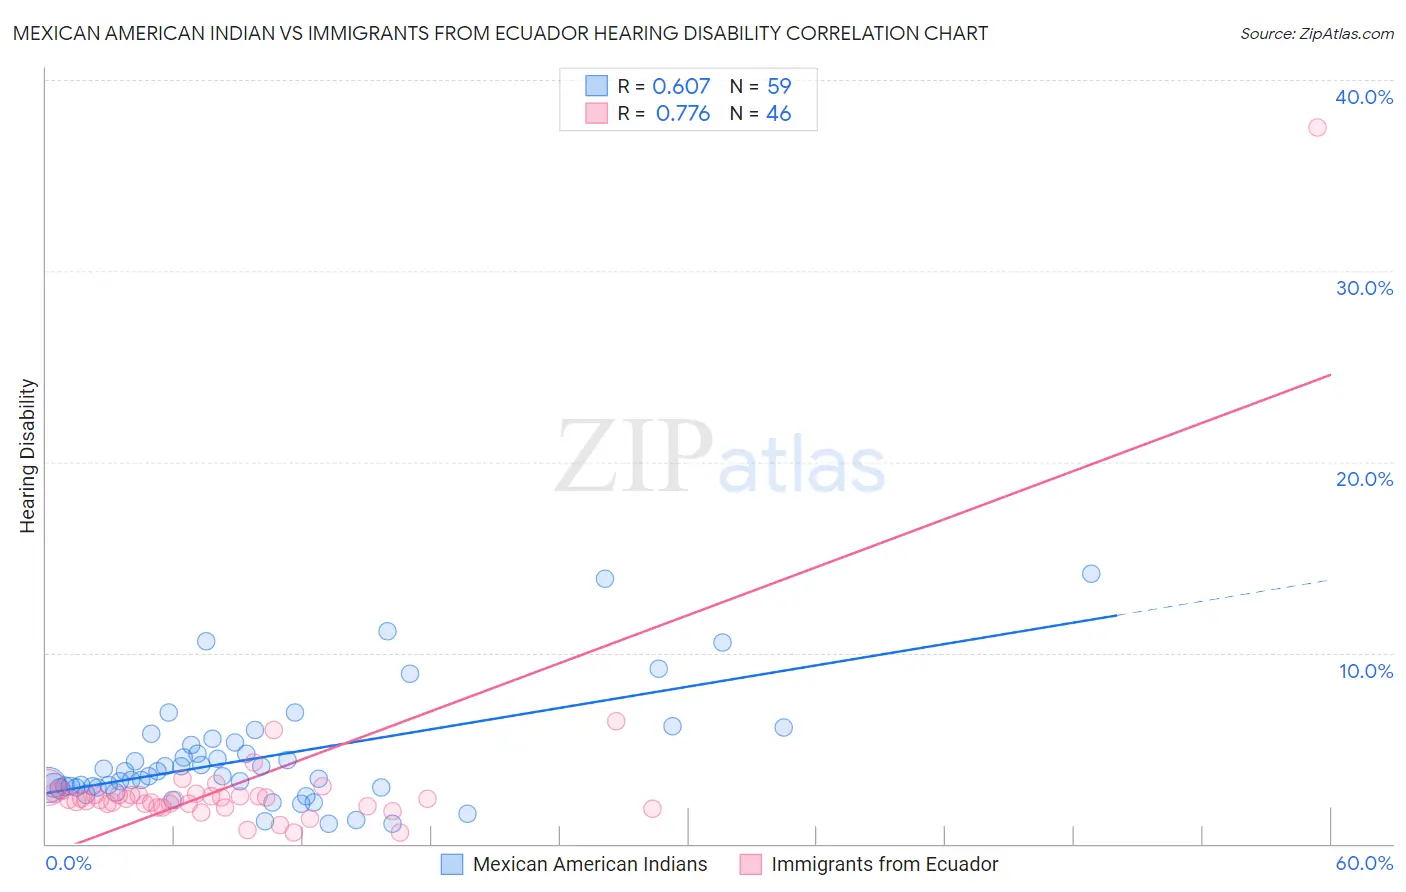
Mexican American Indian vs Immigrants from Ecuador Hearing Disability Correlation Chart
The statistical analysis conducted on geographies consisting of 317,548,375 people shows a significant positive correlation between the proportion of Mexican American Indians and percentage of population with hearing disability in the United States with a correlation coefficient (R) of 0.607 and weighted average of 3.0%. Similarly, the statistical analysis conducted on geographies consisting of 270,917,145 people shows a strong positive correlation between the proportion of Immigrants from Ecuador and percentage of population with hearing disability in the United States with a correlation coefficient (R) of 0.776 and weighted average of 2.5%, a difference of 22.9%.
Hearing Disability Correlation Summary
| Measurement | Mexican American Indian | Immigrants from Ecuador |
| Minimum | 1.0% | 0.57% |
| Maximum | 14.2% | 37.5% |
| Range | 13.2% | 36.9% |
| Mean | 4.5% | 3.2% |
| Median | 3.6% | 2.3% |
| Interquartile 25% (IQ1) | 2.9% | 2.0% |
| Interquartile 75% (IQ3) | 5.3% | 2.6% |
| Interquartile Range (IQR) | 2.3% | 0.59% |
| Standard Deviation (Sample) | 2.9% | 5.3% |
| Standard Deviation (Population) | 2.9% | 5.2% |
Similar Demographics by Hearing Disability
Demographics Similar to Mexican American Indians by Hearing Disability
In terms of hearing disability, the demographic groups most similar to Mexican American Indians are Black/African American (3.0%, a difference of 0.010%), Immigrants from Mexico (3.0%, a difference of 0.020%), Immigrants from Southern Europe (3.0%, a difference of 0.070%), African (3.0%, a difference of 0.19%), and Immigrants from Ireland (3.0%, a difference of 0.27%).
| Demographics | Rating | Rank | Hearing Disability |
| Immigrants | Belgium | 41.5 /100 | #181 | Average 3.0% |
| Immigrants | Italy | 41.1 /100 | #182 | Average 3.0% |
| Bulgarians | 39.7 /100 | #183 | Fair 3.0% |
| Immigrants | Ireland | 37.4 /100 | #184 | Fair 3.0% |
| Immigrants | Southern Europe | 35.3 /100 | #185 | Fair 3.0% |
| Immigrants | Mexico | 34.9 /100 | #186 | Fair 3.0% |
| Blacks/African Americans | 34.7 /100 | #187 | Fair 3.0% |
| Mexican American Indians | 34.7 /100 | #188 | Fair 3.0% |
| Africans | 32.9 /100 | #189 | Fair 3.0% |
| Immigrants | South Africa | 31.1 /100 | #190 | Fair 3.1% |
| Immigrants | Switzerland | 28.8 /100 | #191 | Fair 3.1% |
| Koreans | 27.6 /100 | #192 | Fair 3.1% |
| Macedonians | 27.0 /100 | #193 | Fair 3.1% |
| South Africans | 24.5 /100 | #194 | Fair 3.1% |
| Spanish American Indians | 24.1 /100 | #195 | Fair 3.1% |
Demographics Similar to Immigrants from Ecuador by Hearing Disability
In terms of hearing disability, the demographic groups most similar to Immigrants from Ecuador are Immigrants from Trinidad and Tobago (2.5%, a difference of 0.55%), Trinidadian and Tobagonian (2.5%, a difference of 0.86%), Immigrants from Dominican Republic (2.4%, a difference of 1.0%), Sierra Leonean (2.5%, a difference of 1.1%), and Ecuadorian (2.5%, a difference of 1.4%).
| Demographics | Rating | Rank | Hearing Disability |
| Guyanese | 100.0 /100 | #3 | Exceptional 2.3% |
| Immigrants | Guyana | 100.0 /100 | #4 | Exceptional 2.3% |
| Immigrants | Barbados | 100.0 /100 | #5 | Exceptional 2.4% |
| Vietnamese | 100.0 /100 | #6 | Exceptional 2.4% |
| Immigrants | Bangladesh | 100.0 /100 | #7 | Exceptional 2.4% |
| British West Indians | 100.0 /100 | #8 | Exceptional 2.4% |
| Immigrants | Dominican Republic | 100.0 /100 | #9 | Exceptional 2.4% |
| Immigrants | Ecuador | 99.9 /100 | #10 | Exceptional 2.5% |
| Immigrants | Trinidad and Tobago | 99.9 /100 | #11 | Exceptional 2.5% |
| Trinidadians and Tobagonians | 99.9 /100 | #12 | Exceptional 2.5% |
| Sierra Leoneans | 99.9 /100 | #13 | Exceptional 2.5% |
| Ecuadorians | 99.9 /100 | #14 | Exceptional 2.5% |
| Barbadians | 99.9 /100 | #15 | Exceptional 2.5% |
| Immigrants | West Indies | 99.9 /100 | #16 | Exceptional 2.5% |
| Immigrants | India | 99.9 /100 | #17 | Exceptional 2.5% |