Cree vs Immigrants from Korea Hearing Disability
COMPARE
Cree
Immigrants from Korea
Hearing Disability
Hearing Disability Comparison
Cree
Immigrants from Korea
3.8%
HEARING DISABILITY
0.0/ 100
METRIC RATING
310th/ 347
METRIC RANK
2.7%
HEARING DISABILITY
97.5/ 100
METRIC RATING
74th/ 347
METRIC RANK
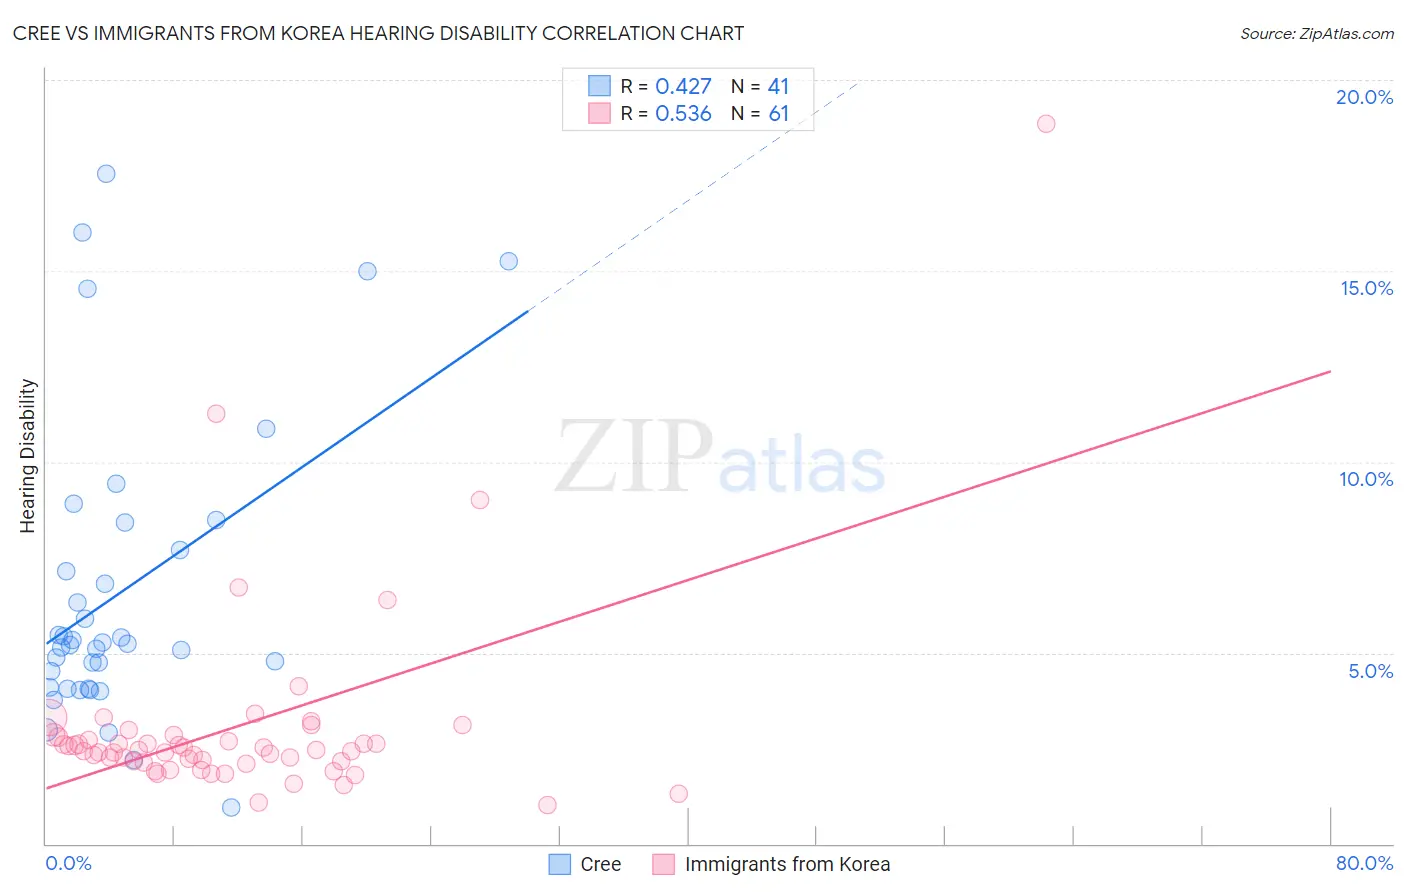
Cree vs Immigrants from Korea Hearing Disability Correlation Chart
The statistical analysis conducted on geographies consisting of 76,207,567 people shows a moderate positive correlation between the proportion of Cree and percentage of population with hearing disability in the United States with a correlation coefficient (R) of 0.427 and weighted average of 3.8%. Similarly, the statistical analysis conducted on geographies consisting of 416,138,137 people shows a substantial positive correlation between the proportion of Immigrants from Korea and percentage of population with hearing disability in the United States with a correlation coefficient (R) of 0.536 and weighted average of 2.7%, a difference of 40.5%.
Hearing Disability Correlation Summary
| Measurement | Cree | Immigrants from Korea |
| Minimum | 0.96% | 1.0% |
| Maximum | 17.6% | 18.9% |
| Range | 16.6% | 17.8% |
| Mean | 6.6% | 3.1% |
| Median | 5.2% | 2.5% |
| Interquartile 25% (IQ1) | 4.1% | 2.1% |
| Interquartile 75% (IQ3) | 8.0% | 2.8% |
| Interquartile Range (IQR) | 4.0% | 0.67% |
| Standard Deviation (Sample) | 3.9% | 2.6% |
| Standard Deviation (Population) | 3.9% | 2.6% |
Similar Demographics by Hearing Disability
Demographics Similar to Cree by Hearing Disability
In terms of hearing disability, the demographic groups most similar to Cree are Scotch-Irish (3.8%, a difference of 0.31%), Ottawa (3.8%, a difference of 0.39%), French Canadian (3.8%, a difference of 0.83%), Marshallese (3.8%, a difference of 0.95%), and American (3.9%, a difference of 1.3%).
| Demographics | Rating | Rank | Hearing Disability |
| Menominee | 0.0 /100 | #303 | Tragic 3.7% |
| French | 0.0 /100 | #304 | Tragic 3.8% |
| English | 0.0 /100 | #305 | Tragic 3.8% |
| Marshallese | 0.0 /100 | #306 | Tragic 3.8% |
| French Canadians | 0.0 /100 | #307 | Tragic 3.8% |
| Ottawa | 0.0 /100 | #308 | Tragic 3.8% |
| Scotch-Irish | 0.0 /100 | #309 | Tragic 3.8% |
| Cree | 0.0 /100 | #310 | Tragic 3.8% |
| Americans | 0.0 /100 | #311 | Tragic 3.9% |
| Cajuns | 0.0 /100 | #312 | Tragic 3.9% |
| Hopi | 0.0 /100 | #313 | Tragic 3.9% |
| Yakama | 0.0 /100 | #314 | Tragic 3.9% |
| Puget Sound Salish | 0.0 /100 | #315 | Tragic 3.9% |
| Spanish Americans | 0.0 /100 | #316 | Tragic 4.0% |
| Comanche | 0.0 /100 | #317 | Tragic 4.0% |
Demographics Similar to Immigrants from Korea by Hearing Disability
In terms of hearing disability, the demographic groups most similar to Immigrants from Korea are Argentinean (2.7%, a difference of 0.0%), Immigrants from Saudi Arabia (2.7%, a difference of 0.030%), Asian (2.7%, a difference of 0.030%), Immigrants from Malaysia (2.7%, a difference of 0.050%), and Afghan (2.7%, a difference of 0.080%).
| Demographics | Rating | Rank | Hearing Disability |
| Egyptians | 98.1 /100 | #67 | Exceptional 2.7% |
| Immigrants | Africa | 98.0 /100 | #68 | Exceptional 2.7% |
| Nicaraguans | 97.9 /100 | #69 | Exceptional 2.7% |
| Peruvians | 97.7 /100 | #70 | Exceptional 2.7% |
| Central Americans | 97.7 /100 | #71 | Exceptional 2.7% |
| Afghans | 97.6 /100 | #72 | Exceptional 2.7% |
| Argentineans | 97.5 /100 | #73 | Exceptional 2.7% |
| Immigrants | Korea | 97.5 /100 | #74 | Exceptional 2.7% |
| Immigrants | Saudi Arabia | 97.5 /100 | #75 | Exceptional 2.7% |
| Asians | 97.5 /100 | #76 | Exceptional 2.7% |
| Immigrants | Malaysia | 97.5 /100 | #77 | Exceptional 2.7% |
| Mongolians | 97.4 /100 | #78 | Exceptional 2.7% |
| Colombians | 97.4 /100 | #79 | Exceptional 2.7% |
| Immigrants | Asia | 97.2 /100 | #80 | Exceptional 2.7% |
| Immigrants | Uruguay | 97.2 /100 | #81 | Exceptional 2.7% |