Cree vs Bahamian Hearing Disability
COMPARE
Cree
Bahamian
Hearing Disability
Hearing Disability Comparison
Cree
Bahamians
3.8%
HEARING DISABILITY
0.0/ 100
METRIC RATING
310th/ 347
METRIC RANK
2.9%
HEARING DISABILITY
88.6/ 100
METRIC RATING
124th/ 347
METRIC RANK
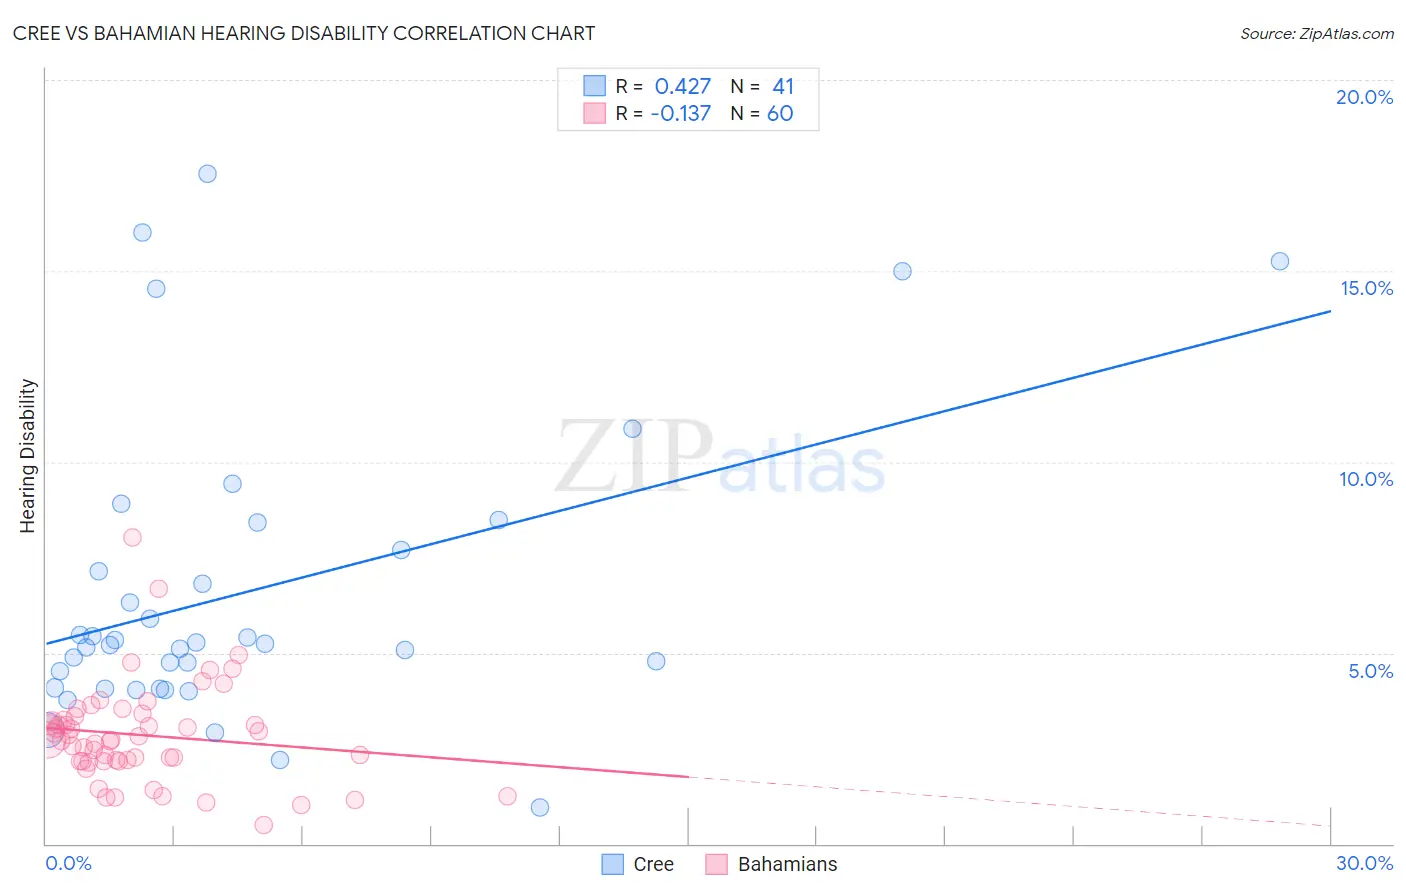
Cree vs Bahamian Hearing Disability Correlation Chart
The statistical analysis conducted on geographies consisting of 76,207,567 people shows a moderate positive correlation between the proportion of Cree and percentage of population with hearing disability in the United States with a correlation coefficient (R) of 0.427 and weighted average of 3.8%. Similarly, the statistical analysis conducted on geographies consisting of 112,647,902 people shows a poor negative correlation between the proportion of Bahamians and percentage of population with hearing disability in the United States with a correlation coefficient (R) of -0.137 and weighted average of 2.9%, a difference of 34.8%.
Hearing Disability Correlation Summary
| Measurement | Cree | Bahamian |
| Minimum | 0.96% | 0.49% |
| Maximum | 17.6% | 8.0% |
| Range | 16.6% | 7.5% |
| Mean | 6.6% | 2.8% |
| Median | 5.2% | 2.7% |
| Interquartile 25% (IQ1) | 4.1% | 2.2% |
| Interquartile 75% (IQ3) | 8.0% | 3.3% |
| Interquartile Range (IQR) | 4.0% | 1.1% |
| Standard Deviation (Sample) | 3.9% | 1.3% |
| Standard Deviation (Population) | 3.9% | 1.3% |
Similar Demographics by Hearing Disability
Demographics Similar to Cree by Hearing Disability
In terms of hearing disability, the demographic groups most similar to Cree are Scotch-Irish (3.8%, a difference of 0.31%), Ottawa (3.8%, a difference of 0.39%), French Canadian (3.8%, a difference of 0.83%), Marshallese (3.8%, a difference of 0.95%), and American (3.9%, a difference of 1.3%).
| Demographics | Rating | Rank | Hearing Disability |
| Menominee | 0.0 /100 | #303 | Tragic 3.7% |
| French | 0.0 /100 | #304 | Tragic 3.8% |
| English | 0.0 /100 | #305 | Tragic 3.8% |
| Marshallese | 0.0 /100 | #306 | Tragic 3.8% |
| French Canadians | 0.0 /100 | #307 | Tragic 3.8% |
| Ottawa | 0.0 /100 | #308 | Tragic 3.8% |
| Scotch-Irish | 0.0 /100 | #309 | Tragic 3.8% |
| Cree | 0.0 /100 | #310 | Tragic 3.8% |
| Americans | 0.0 /100 | #311 | Tragic 3.9% |
| Cajuns | 0.0 /100 | #312 | Tragic 3.9% |
| Hopi | 0.0 /100 | #313 | Tragic 3.9% |
| Yakama | 0.0 /100 | #314 | Tragic 3.9% |
| Puget Sound Salish | 0.0 /100 | #315 | Tragic 3.9% |
| Spanish Americans | 0.0 /100 | #316 | Tragic 4.0% |
| Comanche | 0.0 /100 | #317 | Tragic 4.0% |
Demographics Similar to Bahamians by Hearing Disability
In terms of hearing disability, the demographic groups most similar to Bahamians are Immigrants from Zaire (2.9%, a difference of 0.010%), Immigrants from Albania (2.9%, a difference of 0.030%), Liberian (2.8%, a difference of 0.10%), Cuban (2.8%, a difference of 0.19%), and Immigrants from Sudan (2.9%, a difference of 0.19%).
| Demographics | Rating | Rank | Hearing Disability |
| Immigrants | Liberia | 90.0 /100 | #117 | Excellent 2.8% |
| Zimbabweans | 89.9 /100 | #118 | Excellent 2.8% |
| Kenyans | 89.8 /100 | #119 | Excellent 2.8% |
| Jordanians | 89.5 /100 | #120 | Excellent 2.8% |
| Cubans | 89.4 /100 | #121 | Excellent 2.8% |
| Liberians | 89.0 /100 | #122 | Excellent 2.8% |
| Immigrants | Zaire | 88.6 /100 | #123 | Excellent 2.9% |
| Bahamians | 88.6 /100 | #124 | Excellent 2.9% |
| Immigrants | Albania | 88.5 /100 | #125 | Excellent 2.9% |
| Immigrants | Sudan | 87.8 /100 | #126 | Excellent 2.9% |
| South American Indians | 86.9 /100 | #127 | Excellent 2.9% |
| Immigrants | Western Asia | 86.9 /100 | #128 | Excellent 2.9% |
| Immigrants | Uganda | 86.6 /100 | #129 | Excellent 2.9% |
| Immigrants | Vietnam | 86.5 /100 | #130 | Excellent 2.9% |
| Immigrants | Kenya | 86.1 /100 | #131 | Excellent 2.9% |