Colville vs Hmong Cognitive Disability
COMPARE
Colville
Hmong
Cognitive Disability
Cognitive Disability Comparison
Colville
Hmong
18.3%
COGNITIVE DISABILITY
0.0/ 100
METRIC RATING
305th/ 347
METRIC RANK
18.4%
COGNITIVE DISABILITY
0.0/ 100
METRIC RATING
311th/ 347
METRIC RANK
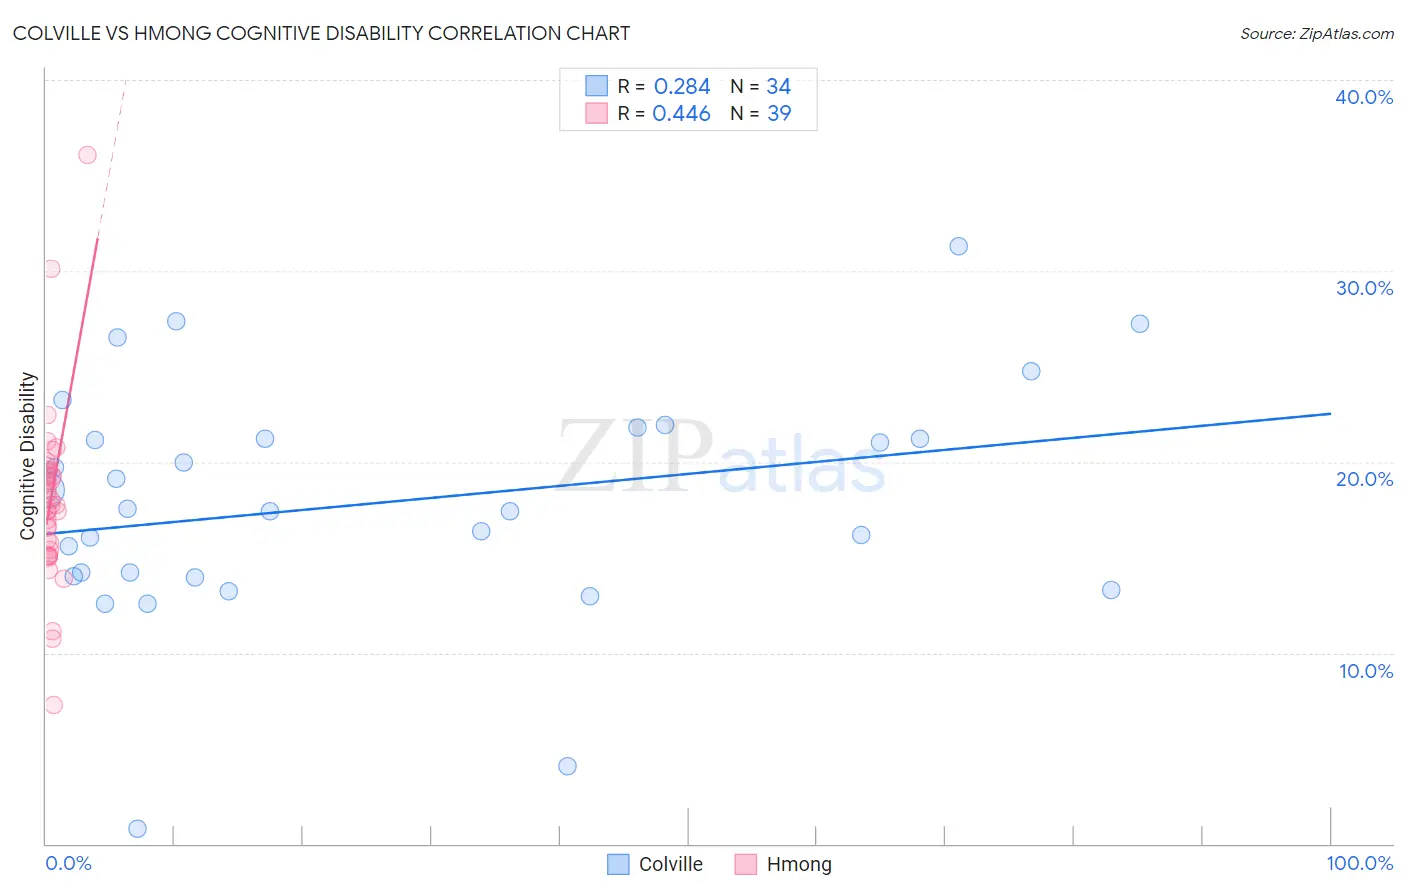
Colville vs Hmong Cognitive Disability Correlation Chart
The statistical analysis conducted on geographies consisting of 34,687,480 people shows a weak positive correlation between the proportion of Colville and percentage of population with cognitive disability in the United States with a correlation coefficient (R) of 0.284 and weighted average of 18.3%. Similarly, the statistical analysis conducted on geographies consisting of 24,607,802 people shows a moderate positive correlation between the proportion of Hmong and percentage of population with cognitive disability in the United States with a correlation coefficient (R) of 0.446 and weighted average of 18.4%, a difference of 0.53%.
Cognitive Disability Correlation Summary
| Measurement | Colville | Hmong |
| Minimum | 0.79% | 7.3% |
| Maximum | 31.3% | 36.1% |
| Range | 30.5% | 28.8% |
| Mean | 17.9% | 18.0% |
| Median | 17.5% | 17.8% |
| Interquartile 25% (IQ1) | 14.0% | 15.4% |
| Interquartile 75% (IQ3) | 21.2% | 19.6% |
| Interquartile Range (IQR) | 7.2% | 4.2% |
| Standard Deviation (Sample) | 6.2% | 4.7% |
| Standard Deviation (Population) | 6.1% | 4.6% |
Demographics Similar to Colville and Hmong by Cognitive Disability
In terms of cognitive disability, the demographic groups most similar to Colville are Seminole (18.3%, a difference of 0.010%), Ugandan (18.3%, a difference of 0.010%), Immigrants from Western Africa (18.4%, a difference of 0.10%), Immigrants from Eritrea (18.3%, a difference of 0.12%), and Immigrants from Eastern Africa (18.4%, a difference of 0.14%). Similarly, the demographic groups most similar to Hmong are Choctaw (18.4%, a difference of 0.030%), Chickasaw (18.5%, a difference of 0.29%), Yaqui (18.5%, a difference of 0.39%), Immigrants from Eastern Africa (18.4%, a difference of 0.40%), and Immigrants from Western Africa (18.4%, a difference of 0.44%).
| Demographics | Rating | Rank | Cognitive Disability |
| Japanese | 0.0 /100 | #298 | Tragic 18.3% |
| Ghanaians | 0.0 /100 | #299 | Tragic 18.3% |
| Creek | 0.0 /100 | #300 | Tragic 18.3% |
| Immigrants | Ghana | 0.0 /100 | #301 | Tragic 18.3% |
| Barbadians | 0.0 /100 | #302 | Tragic 18.3% |
| Immigrants | Kenya | 0.0 /100 | #303 | Tragic 18.3% |
| Immigrants | Eritrea | 0.0 /100 | #304 | Tragic 18.3% |
| Colville | 0.0 /100 | #305 | Tragic 18.3% |
| Seminole | 0.0 /100 | #306 | Tragic 18.3% |
| Ugandans | 0.0 /100 | #307 | Tragic 18.3% |
| Immigrants | Western Africa | 0.0 /100 | #308 | Tragic 18.4% |
| Immigrants | Eastern Africa | 0.0 /100 | #309 | Tragic 18.4% |
| Choctaw | 0.0 /100 | #310 | Tragic 18.4% |
| Hmong | 0.0 /100 | #311 | Tragic 18.4% |
| Chickasaw | 0.0 /100 | #312 | Tragic 18.5% |
| Yaqui | 0.0 /100 | #313 | Tragic 18.5% |
| Sub-Saharan Africans | 0.0 /100 | #314 | Tragic 18.5% |
| Immigrants | Dominica | 0.0 /100 | #315 | Tragic 18.6% |
| Immigrants | Middle Africa | 0.0 /100 | #316 | Tragic 18.6% |
| Liberians | 0.0 /100 | #317 | Tragic 18.6% |
| Bangladeshis | 0.0 /100 | #318 | Tragic 18.6% |