Colville vs Slavic Cognitive Disability
COMPARE
Colville
Slavic
Cognitive Disability
Cognitive Disability Comparison
Colville
Slavs
18.3%
COGNITIVE DISABILITY
0.0/ 100
METRIC RATING
305th/ 347
METRIC RANK
16.7%
COGNITIVE DISABILITY
99.3/ 100
METRIC RATING
74th/ 347
METRIC RANK
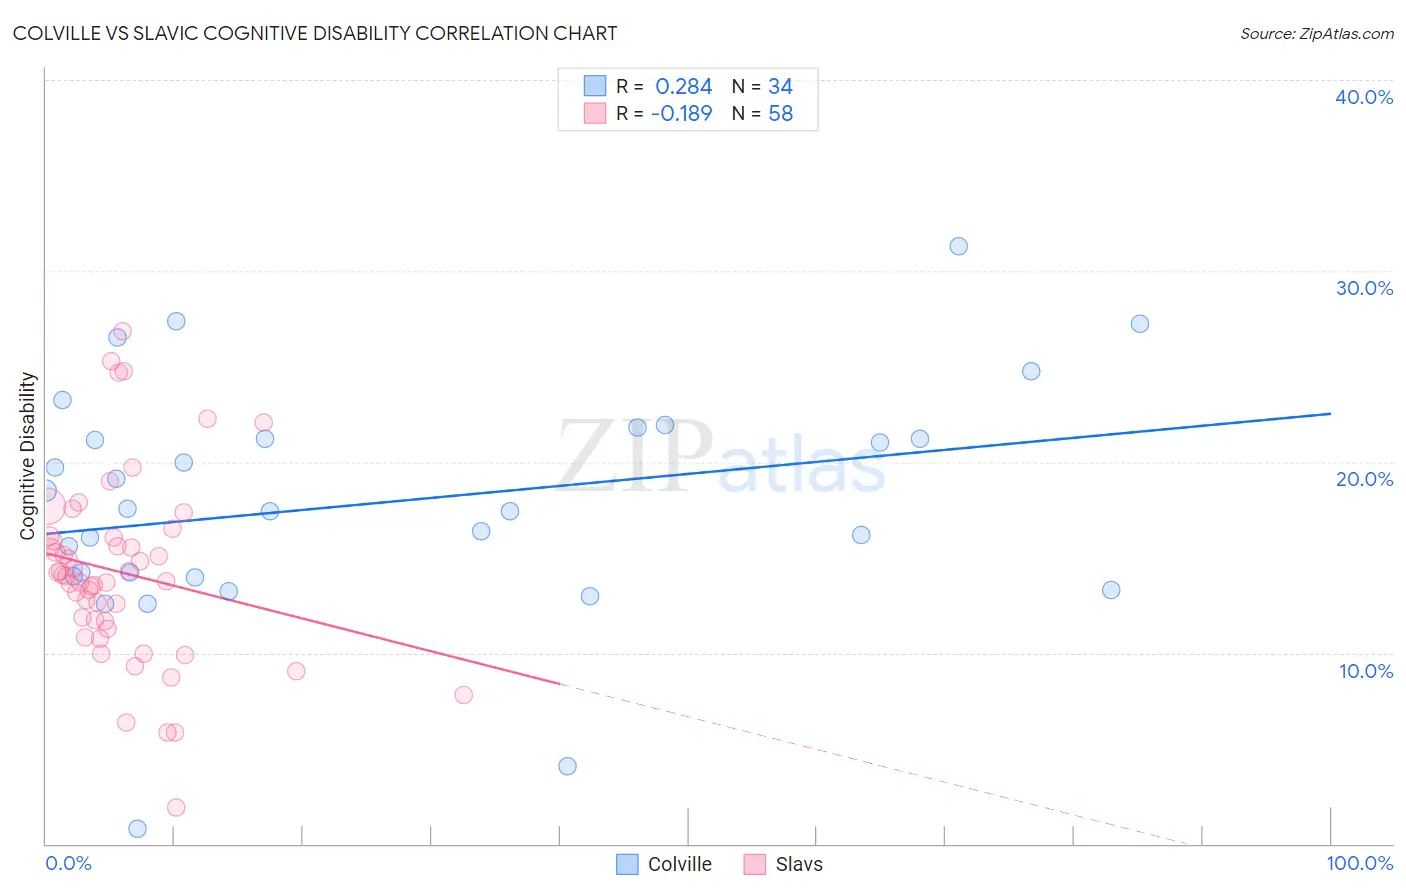
Colville vs Slavic Cognitive Disability Correlation Chart
The statistical analysis conducted on geographies consisting of 34,687,480 people shows a weak positive correlation between the proportion of Colville and percentage of population with cognitive disability in the United States with a correlation coefficient (R) of 0.284 and weighted average of 18.3%. Similarly, the statistical analysis conducted on geographies consisting of 270,861,069 people shows a poor negative correlation between the proportion of Slavs and percentage of population with cognitive disability in the United States with a correlation coefficient (R) of -0.189 and weighted average of 16.7%, a difference of 10.1%.
Cognitive Disability Correlation Summary
| Measurement | Colville | Slavic |
| Minimum | 0.79% | 1.9% |
| Maximum | 31.3% | 26.8% |
| Range | 30.5% | 24.9% |
| Mean | 17.9% | 14.2% |
| Median | 17.5% | 14.0% |
| Interquartile 25% (IQ1) | 14.0% | 11.6% |
| Interquartile 75% (IQ3) | 21.2% | 16.0% |
| Interquartile Range (IQR) | 7.2% | 4.4% |
| Standard Deviation (Sample) | 6.2% | 4.9% |
| Standard Deviation (Population) | 6.1% | 4.8% |
Similar Demographics by Cognitive Disability
Demographics Similar to Colville by Cognitive Disability
In terms of cognitive disability, the demographic groups most similar to Colville are Seminole (18.3%, a difference of 0.010%), Ugandan (18.3%, a difference of 0.010%), Immigrants from Western Africa (18.4%, a difference of 0.10%), Immigrants from Eritrea (18.3%, a difference of 0.12%), and Immigrants from Eastern Africa (18.4%, a difference of 0.14%).
| Demographics | Rating | Rank | Cognitive Disability |
| Japanese | 0.0 /100 | #298 | Tragic 18.3% |
| Ghanaians | 0.0 /100 | #299 | Tragic 18.3% |
| Creek | 0.0 /100 | #300 | Tragic 18.3% |
| Immigrants | Ghana | 0.0 /100 | #301 | Tragic 18.3% |
| Barbadians | 0.0 /100 | #302 | Tragic 18.3% |
| Immigrants | Kenya | 0.0 /100 | #303 | Tragic 18.3% |
| Immigrants | Eritrea | 0.0 /100 | #304 | Tragic 18.3% |
| Colville | 0.0 /100 | #305 | Tragic 18.3% |
| Seminole | 0.0 /100 | #306 | Tragic 18.3% |
| Ugandans | 0.0 /100 | #307 | Tragic 18.3% |
| Immigrants | Western Africa | 0.0 /100 | #308 | Tragic 18.4% |
| Immigrants | Eastern Africa | 0.0 /100 | #309 | Tragic 18.4% |
| Choctaw | 0.0 /100 | #310 | Tragic 18.4% |
| Hmong | 0.0 /100 | #311 | Tragic 18.4% |
| Chickasaw | 0.0 /100 | #312 | Tragic 18.5% |
Demographics Similar to Slavs by Cognitive Disability
In terms of cognitive disability, the demographic groups most similar to Slavs are Burmese (16.7%, a difference of 0.0%), German (16.7%, a difference of 0.010%), Estonian (16.7%, a difference of 0.010%), Immigrants from Sweden (16.7%, a difference of 0.030%), and Immigrants from Belgium (16.7%, a difference of 0.030%).
| Demographics | Rating | Rank | Cognitive Disability |
| Latvians | 99.5 /100 | #67 | Exceptional 16.6% |
| Ukrainians | 99.4 /100 | #68 | Exceptional 16.6% |
| Immigrants | Uzbekistan | 99.4 /100 | #69 | Exceptional 16.7% |
| Immigrants | Sweden | 99.4 /100 | #70 | Exceptional 16.7% |
| Immigrants | Belgium | 99.3 /100 | #71 | Exceptional 16.7% |
| Germans | 99.3 /100 | #72 | Exceptional 16.7% |
| Burmese | 99.3 /100 | #73 | Exceptional 16.7% |
| Slavs | 99.3 /100 | #74 | Exceptional 16.7% |
| Estonians | 99.3 /100 | #75 | Exceptional 16.7% |
| Immigrants | Serbia | 99.3 /100 | #76 | Exceptional 16.7% |
| Immigrants | Hungary | 99.3 /100 | #77 | Exceptional 16.7% |
| Peruvians | 99.3 /100 | #78 | Exceptional 16.7% |
| Immigrants | Bulgaria | 99.3 /100 | #79 | Exceptional 16.7% |
| Egyptians | 99.2 /100 | #80 | Exceptional 16.7% |
| Immigrants | Netherlands | 99.2 /100 | #81 | Exceptional 16.7% |