Colville vs Immigrants from Korea Cognitive Disability
COMPARE
Colville
Immigrants from Korea
Cognitive Disability
Cognitive Disability Comparison
Colville
Immigrants from Korea
18.3%
COGNITIVE DISABILITY
0.0/ 100
METRIC RATING
305th/ 347
METRIC RANK
16.5%
COGNITIVE DISABILITY
99.8/ 100
METRIC RATING
51st/ 347
METRIC RANK
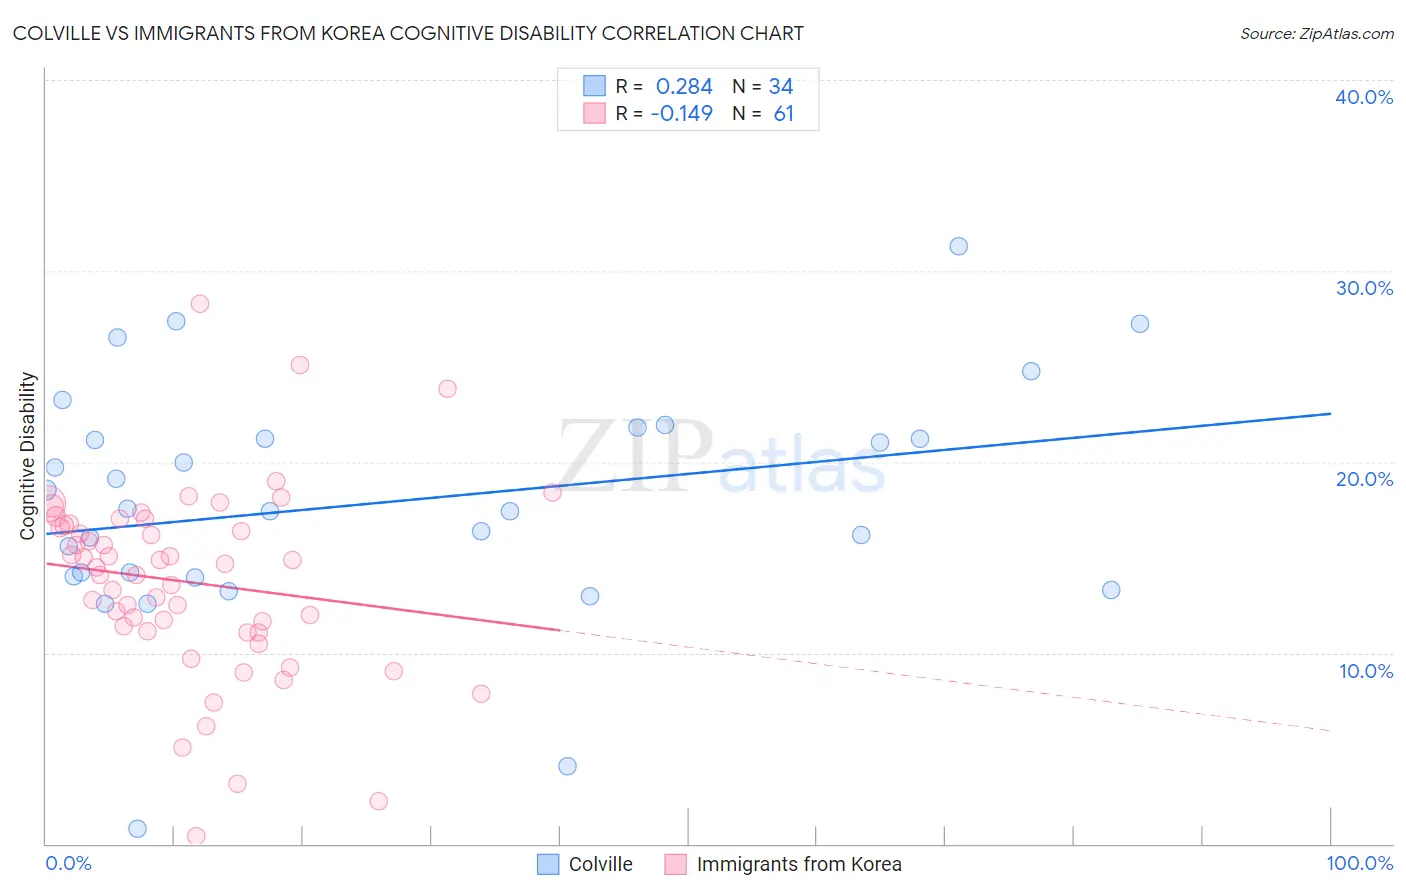
Colville vs Immigrants from Korea Cognitive Disability Correlation Chart
The statistical analysis conducted on geographies consisting of 34,687,480 people shows a weak positive correlation between the proportion of Colville and percentage of population with cognitive disability in the United States with a correlation coefficient (R) of 0.284 and weighted average of 18.3%. Similarly, the statistical analysis conducted on geographies consisting of 416,300,035 people shows a poor negative correlation between the proportion of Immigrants from Korea and percentage of population with cognitive disability in the United States with a correlation coefficient (R) of -0.149 and weighted average of 16.5%, a difference of 11.1%.
Cognitive Disability Correlation Summary
| Measurement | Colville | Immigrants from Korea |
| Minimum | 0.79% | 0.40% |
| Maximum | 31.3% | 28.3% |
| Range | 30.5% | 27.9% |
| Mean | 17.9% | 13.7% |
| Median | 17.5% | 14.4% |
| Interquartile 25% (IQ1) | 14.0% | 11.1% |
| Interquartile 75% (IQ3) | 21.2% | 16.7% |
| Interquartile Range (IQR) | 7.2% | 5.6% |
| Standard Deviation (Sample) | 6.2% | 5.0% |
| Standard Deviation (Population) | 6.1% | 4.9% |
Similar Demographics by Cognitive Disability
Demographics Similar to Colville by Cognitive Disability
In terms of cognitive disability, the demographic groups most similar to Colville are Seminole (18.3%, a difference of 0.010%), Ugandan (18.3%, a difference of 0.010%), Immigrants from Western Africa (18.4%, a difference of 0.10%), Immigrants from Eritrea (18.3%, a difference of 0.12%), and Immigrants from Eastern Africa (18.4%, a difference of 0.14%).
| Demographics | Rating | Rank | Cognitive Disability |
| Japanese | 0.0 /100 | #298 | Tragic 18.3% |
| Ghanaians | 0.0 /100 | #299 | Tragic 18.3% |
| Creek | 0.0 /100 | #300 | Tragic 18.3% |
| Immigrants | Ghana | 0.0 /100 | #301 | Tragic 18.3% |
| Barbadians | 0.0 /100 | #302 | Tragic 18.3% |
| Immigrants | Kenya | 0.0 /100 | #303 | Tragic 18.3% |
| Immigrants | Eritrea | 0.0 /100 | #304 | Tragic 18.3% |
| Colville | 0.0 /100 | #305 | Tragic 18.3% |
| Seminole | 0.0 /100 | #306 | Tragic 18.3% |
| Ugandans | 0.0 /100 | #307 | Tragic 18.3% |
| Immigrants | Western Africa | 0.0 /100 | #308 | Tragic 18.4% |
| Immigrants | Eastern Africa | 0.0 /100 | #309 | Tragic 18.4% |
| Choctaw | 0.0 /100 | #310 | Tragic 18.4% |
| Hmong | 0.0 /100 | #311 | Tragic 18.4% |
| Chickasaw | 0.0 /100 | #312 | Tragic 18.5% |
Demographics Similar to Immigrants from Korea by Cognitive Disability
In terms of cognitive disability, the demographic groups most similar to Immigrants from Korea are Soviet Union (16.5%, a difference of 0.040%), Iranian (16.5%, a difference of 0.050%), Norwegian (16.5%, a difference of 0.050%), Immigrants from Italy (16.5%, a difference of 0.090%), and Immigrants from North America (16.5%, a difference of 0.090%).
| Demographics | Rating | Rank | Cognitive Disability |
| Macedonians | 99.8 /100 | #44 | Exceptional 16.5% |
| Immigrants | Europe | 99.8 /100 | #45 | Exceptional 16.5% |
| Immigrants | Colombia | 99.8 /100 | #46 | Exceptional 16.5% |
| Immigrants | Italy | 99.8 /100 | #47 | Exceptional 16.5% |
| Immigrants | North America | 99.8 /100 | #48 | Exceptional 16.5% |
| Iranians | 99.8 /100 | #49 | Exceptional 16.5% |
| Norwegians | 99.8 /100 | #50 | Exceptional 16.5% |
| Immigrants | Korea | 99.8 /100 | #51 | Exceptional 16.5% |
| Soviet Union | 99.8 /100 | #52 | Exceptional 16.5% |
| Swedes | 99.8 /100 | #53 | Exceptional 16.5% |
| Immigrants | Iran | 99.8 /100 | #54 | Exceptional 16.5% |
| Immigrants | Venezuela | 99.7 /100 | #55 | Exceptional 16.5% |
| Austrians | 99.7 /100 | #56 | Exceptional 16.6% |
| Bhutanese | 99.7 /100 | #57 | Exceptional 16.6% |
| Pennsylvania Germans | 99.7 /100 | #58 | Exceptional 16.6% |