Paiute vs Hmong Cognitive Disability
COMPARE
Paiute
Hmong
Cognitive Disability
Cognitive Disability Comparison
Paiute
Hmong
17.8%
COGNITIVE DISABILITY
1.1/ 100
METRIC RATING
242nd/ 347
METRIC RANK
18.4%
COGNITIVE DISABILITY
0.0/ 100
METRIC RATING
311th/ 347
METRIC RANK
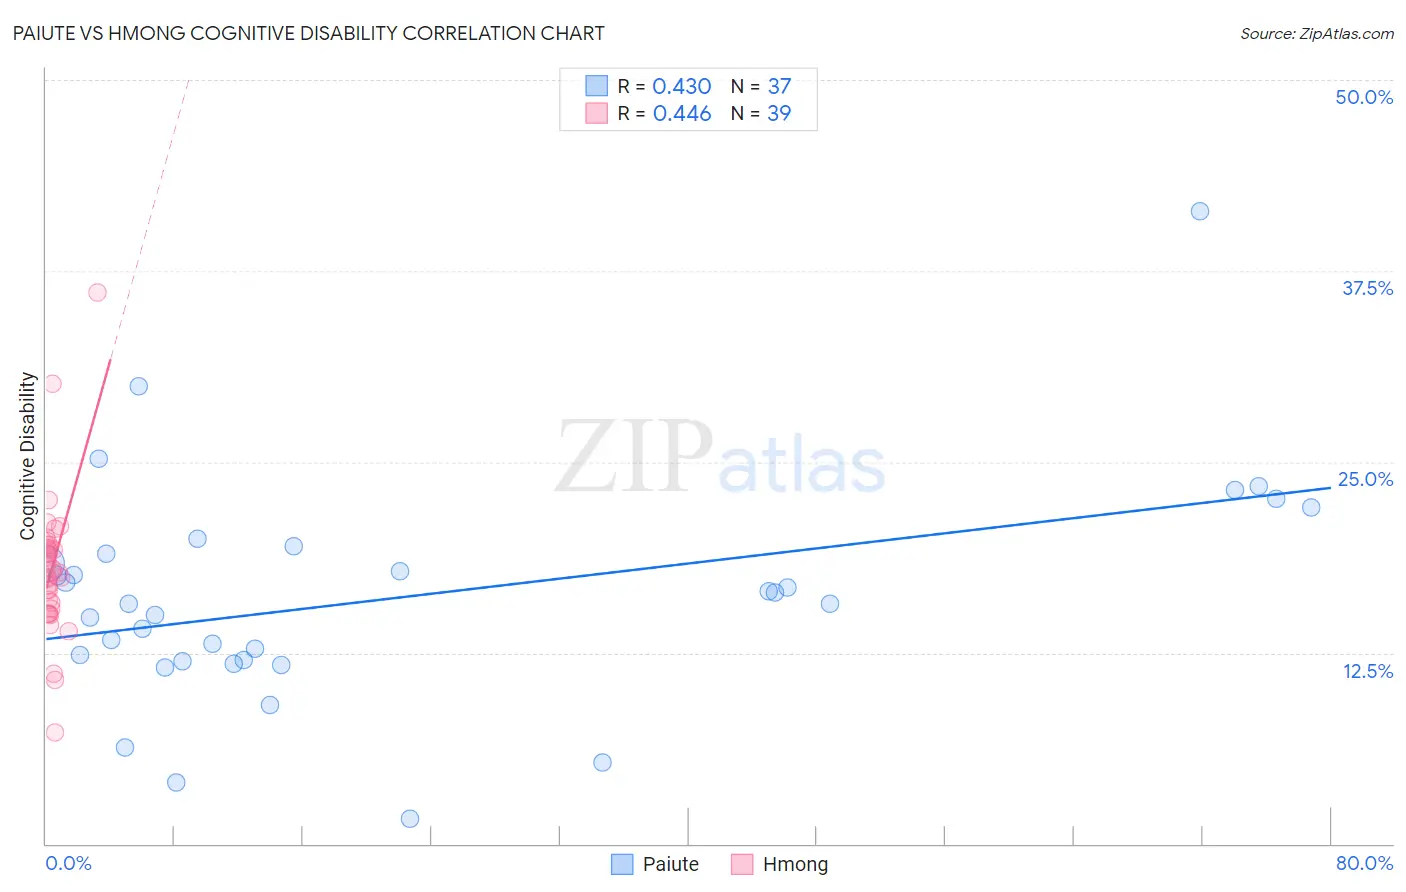
Paiute vs Hmong Cognitive Disability Correlation Chart
The statistical analysis conducted on geographies consisting of 58,394,773 people shows a moderate positive correlation between the proportion of Paiute and percentage of population with cognitive disability in the United States with a correlation coefficient (R) of 0.430 and weighted average of 17.8%. Similarly, the statistical analysis conducted on geographies consisting of 24,607,802 people shows a moderate positive correlation between the proportion of Hmong and percentage of population with cognitive disability in the United States with a correlation coefficient (R) of 0.446 and weighted average of 18.4%, a difference of 3.4%.
Cognitive Disability Correlation Summary
| Measurement | Paiute | Hmong |
| Minimum | 1.6% | 7.3% |
| Maximum | 41.4% | 36.1% |
| Range | 39.8% | 28.8% |
| Mean | 16.1% | 18.0% |
| Median | 15.8% | 17.8% |
| Interquartile 25% (IQ1) | 12.0% | 15.4% |
| Interquartile 75% (IQ3) | 19.2% | 19.6% |
| Interquartile Range (IQR) | 7.2% | 4.2% |
| Standard Deviation (Sample) | 7.3% | 4.7% |
| Standard Deviation (Population) | 7.2% | 4.6% |
Similar Demographics by Cognitive Disability
Demographics Similar to Paiute by Cognitive Disability
In terms of cognitive disability, the demographic groups most similar to Paiute are Mexican (17.8%, a difference of 0.020%), Immigrants from Bangladesh (17.8%, a difference of 0.070%), Jamaican (17.9%, a difference of 0.11%), Iraqi (17.8%, a difference of 0.16%), and Cajun (17.8%, a difference of 0.19%).
| Demographics | Rating | Rank | Cognitive Disability |
| Spanish American Indians | 2.0 /100 | #235 | Tragic 17.8% |
| Immigrants | Iraq | 1.8 /100 | #236 | Tragic 17.8% |
| Immigrants | Mexico | 1.8 /100 | #237 | Tragic 17.8% |
| Cheyenne | 1.7 /100 | #238 | Tragic 17.8% |
| Cajuns | 1.4 /100 | #239 | Tragic 17.8% |
| Iraqis | 1.4 /100 | #240 | Tragic 17.8% |
| Mexicans | 1.1 /100 | #241 | Tragic 17.8% |
| Paiute | 1.1 /100 | #242 | Tragic 17.8% |
| Immigrants | Bangladesh | 1.0 /100 | #243 | Tragic 17.8% |
| Jamaicans | 0.9 /100 | #244 | Tragic 17.9% |
| Trinidadians and Tobagonians | 0.8 /100 | #245 | Tragic 17.9% |
| Immigrants | Thailand | 0.8 /100 | #246 | Tragic 17.9% |
| Samoans | 0.7 /100 | #247 | Tragic 17.9% |
| French American Indians | 0.7 /100 | #248 | Tragic 17.9% |
| Cree | 0.7 /100 | #249 | Tragic 17.9% |
Demographics Similar to Hmong by Cognitive Disability
In terms of cognitive disability, the demographic groups most similar to Hmong are Choctaw (18.4%, a difference of 0.030%), Chickasaw (18.5%, a difference of 0.29%), Yaqui (18.5%, a difference of 0.39%), Immigrants from Eastern Africa (18.4%, a difference of 0.40%), and Immigrants from Western Africa (18.4%, a difference of 0.44%).
| Demographics | Rating | Rank | Cognitive Disability |
| Immigrants | Eritrea | 0.0 /100 | #304 | Tragic 18.3% |
| Colville | 0.0 /100 | #305 | Tragic 18.3% |
| Seminole | 0.0 /100 | #306 | Tragic 18.3% |
| Ugandans | 0.0 /100 | #307 | Tragic 18.3% |
| Immigrants | Western Africa | 0.0 /100 | #308 | Tragic 18.4% |
| Immigrants | Eastern Africa | 0.0 /100 | #309 | Tragic 18.4% |
| Choctaw | 0.0 /100 | #310 | Tragic 18.4% |
| Hmong | 0.0 /100 | #311 | Tragic 18.4% |
| Chickasaw | 0.0 /100 | #312 | Tragic 18.5% |
| Yaqui | 0.0 /100 | #313 | Tragic 18.5% |
| Sub-Saharan Africans | 0.0 /100 | #314 | Tragic 18.5% |
| Immigrants | Dominica | 0.0 /100 | #315 | Tragic 18.6% |
| Immigrants | Middle Africa | 0.0 /100 | #316 | Tragic 18.6% |
| Liberians | 0.0 /100 | #317 | Tragic 18.6% |
| Bangladeshis | 0.0 /100 | #318 | Tragic 18.6% |