Carpatho Rusyn vs Hmong Cognitive Disability
COMPARE
Carpatho Rusyn
Hmong
Cognitive Disability
Cognitive Disability Comparison
Carpatho Rusyns
Hmong
17.0%
COGNITIVE DISABILITY
89.6/ 100
METRIC RATING
142nd/ 347
METRIC RANK
18.4%
COGNITIVE DISABILITY
0.0/ 100
METRIC RATING
311th/ 347
METRIC RANK
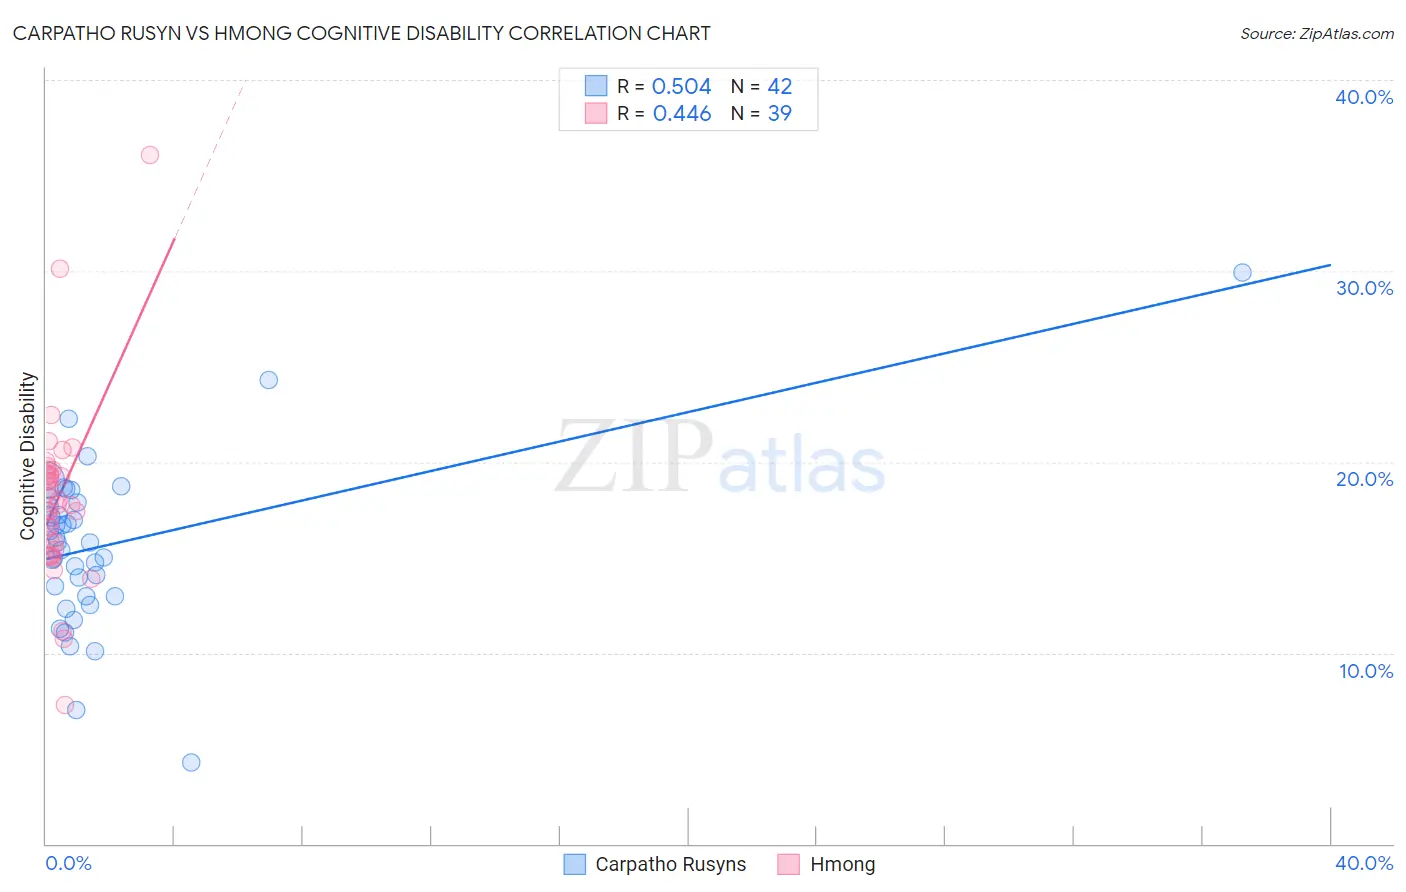
Carpatho Rusyn vs Hmong Cognitive Disability Correlation Chart
The statistical analysis conducted on geographies consisting of 58,872,415 people shows a substantial positive correlation between the proportion of Carpatho Rusyns and percentage of population with cognitive disability in the United States with a correlation coefficient (R) of 0.504 and weighted average of 17.0%. Similarly, the statistical analysis conducted on geographies consisting of 24,607,802 people shows a moderate positive correlation between the proportion of Hmong and percentage of population with cognitive disability in the United States with a correlation coefficient (R) of 0.446 and weighted average of 18.4%, a difference of 8.4%.
Cognitive Disability Correlation Summary
| Measurement | Carpatho Rusyn | Hmong |
| Minimum | 4.3% | 7.3% |
| Maximum | 29.9% | 36.1% |
| Range | 25.6% | 28.8% |
| Mean | 15.6% | 18.0% |
| Median | 15.8% | 17.8% |
| Interquartile 25% (IQ1) | 13.0% | 15.4% |
| Interquartile 75% (IQ3) | 17.9% | 19.6% |
| Interquartile Range (IQR) | 4.9% | 4.2% |
| Standard Deviation (Sample) | 4.4% | 4.7% |
| Standard Deviation (Population) | 4.3% | 4.6% |
Similar Demographics by Cognitive Disability
Demographics Similar to Carpatho Rusyns by Cognitive Disability
In terms of cognitive disability, the demographic groups most similar to Carpatho Rusyns are Aleut (17.0%, a difference of 0.020%), British (17.0%, a difference of 0.020%), Immigrants from Brazil (17.0%, a difference of 0.020%), French (17.0%, a difference of 0.030%), and Chilean (17.0%, a difference of 0.030%).
| Demographics | Rating | Rank | Cognitive Disability |
| Lebanese | 91.3 /100 | #135 | Exceptional 17.0% |
| Israelis | 91.0 /100 | #136 | Exceptional 17.0% |
| Immigrants | Norway | 90.9 /100 | #137 | Exceptional 17.0% |
| Welsh | 90.8 /100 | #138 | Exceptional 17.0% |
| French | 90.0 /100 | #139 | Excellent 17.0% |
| Chileans | 89.9 /100 | #140 | Excellent 17.0% |
| Aleuts | 89.9 /100 | #141 | Excellent 17.0% |
| Carpatho Rusyns | 89.6 /100 | #142 | Excellent 17.0% |
| British | 89.3 /100 | #143 | Excellent 17.0% |
| Immigrants | Brazil | 89.3 /100 | #144 | Excellent 17.0% |
| Immigrants | South Eastern Asia | 88.7 /100 | #145 | Excellent 17.0% |
| Costa Ricans | 88.0 /100 | #146 | Excellent 17.0% |
| Scotch-Irish | 85.9 /100 | #147 | Excellent 17.1% |
| French Canadians | 85.7 /100 | #148 | Excellent 17.1% |
| Cypriots | 85.7 /100 | #149 | Excellent 17.1% |
Demographics Similar to Hmong by Cognitive Disability
In terms of cognitive disability, the demographic groups most similar to Hmong are Choctaw (18.4%, a difference of 0.030%), Chickasaw (18.5%, a difference of 0.29%), Yaqui (18.5%, a difference of 0.39%), Immigrants from Eastern Africa (18.4%, a difference of 0.40%), and Immigrants from Western Africa (18.4%, a difference of 0.44%).
| Demographics | Rating | Rank | Cognitive Disability |
| Immigrants | Eritrea | 0.0 /100 | #304 | Tragic 18.3% |
| Colville | 0.0 /100 | #305 | Tragic 18.3% |
| Seminole | 0.0 /100 | #306 | Tragic 18.3% |
| Ugandans | 0.0 /100 | #307 | Tragic 18.3% |
| Immigrants | Western Africa | 0.0 /100 | #308 | Tragic 18.4% |
| Immigrants | Eastern Africa | 0.0 /100 | #309 | Tragic 18.4% |
| Choctaw | 0.0 /100 | #310 | Tragic 18.4% |
| Hmong | 0.0 /100 | #311 | Tragic 18.4% |
| Chickasaw | 0.0 /100 | #312 | Tragic 18.5% |
| Yaqui | 0.0 /100 | #313 | Tragic 18.5% |
| Sub-Saharan Africans | 0.0 /100 | #314 | Tragic 18.5% |
| Immigrants | Dominica | 0.0 /100 | #315 | Tragic 18.6% |
| Immigrants | Middle Africa | 0.0 /100 | #316 | Tragic 18.6% |
| Liberians | 0.0 /100 | #317 | Tragic 18.6% |
| Bangladeshis | 0.0 /100 | #318 | Tragic 18.6% |