Colville vs Delaware Cognitive Disability
COMPARE
Colville
Delaware
Cognitive Disability
Cognitive Disability Comparison
Colville
Delaware
18.3%
COGNITIVE DISABILITY
0.0/ 100
METRIC RATING
305th/ 347
METRIC RANK
17.4%
COGNITIVE DISABILITY
25.6/ 100
METRIC RATING
193rd/ 347
METRIC RANK
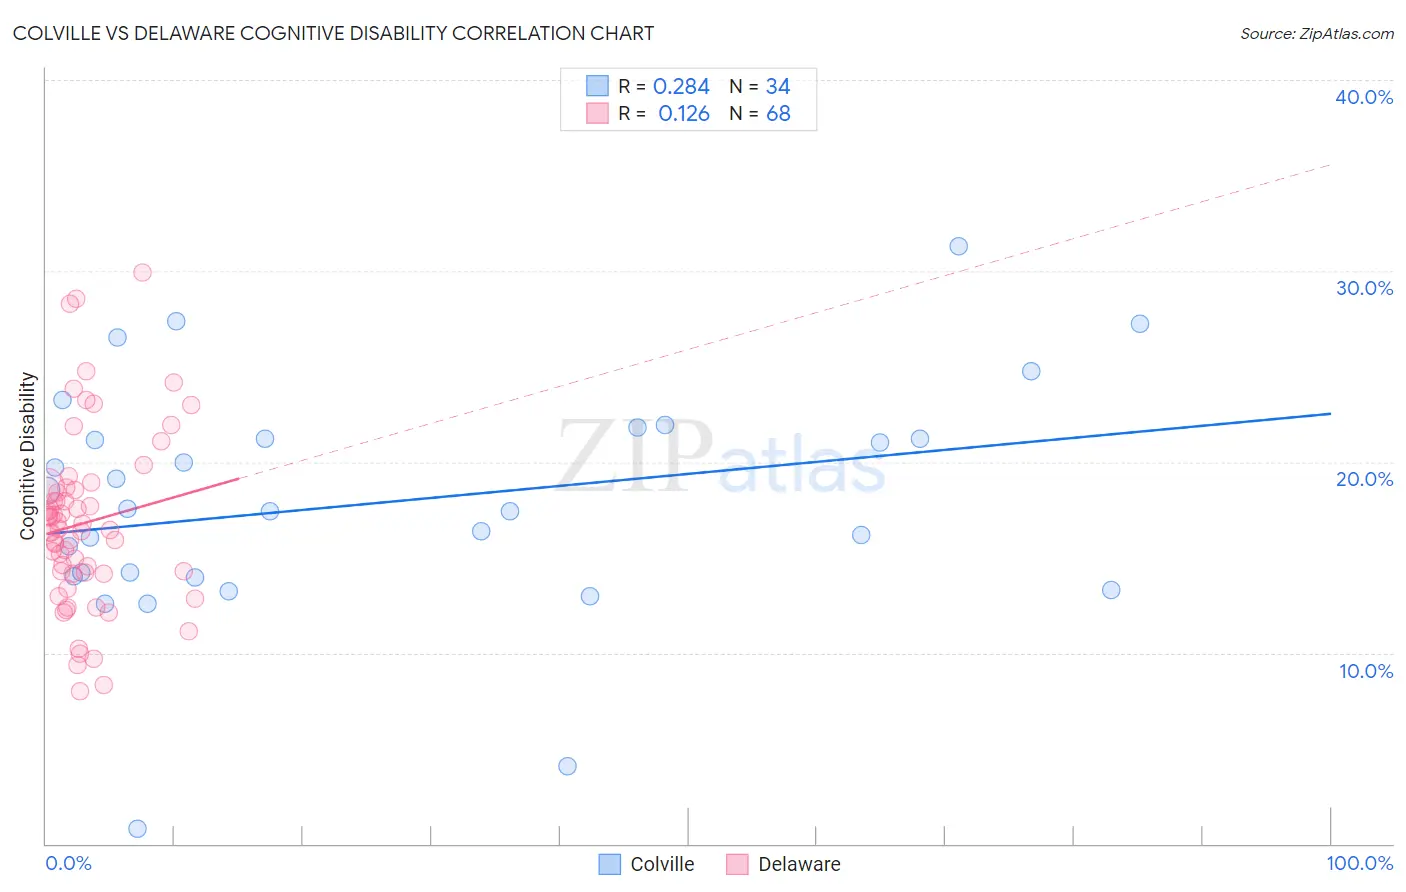
Colville vs Delaware Cognitive Disability Correlation Chart
The statistical analysis conducted on geographies consisting of 34,687,480 people shows a weak positive correlation between the proportion of Colville and percentage of population with cognitive disability in the United States with a correlation coefficient (R) of 0.284 and weighted average of 18.3%. Similarly, the statistical analysis conducted on geographies consisting of 96,240,838 people shows a poor positive correlation between the proportion of Delaware and percentage of population with cognitive disability in the United States with a correlation coefficient (R) of 0.126 and weighted average of 17.4%, a difference of 5.4%.
Cognitive Disability Correlation Summary
| Measurement | Colville | Delaware |
| Minimum | 0.79% | 8.0% |
| Maximum | 31.3% | 29.9% |
| Range | 30.5% | 21.9% |
| Mean | 17.9% | 16.8% |
| Median | 17.5% | 16.5% |
| Interquartile 25% (IQ1) | 14.0% | 14.2% |
| Interquartile 75% (IQ3) | 21.2% | 18.6% |
| Interquartile Range (IQR) | 7.2% | 4.4% |
| Standard Deviation (Sample) | 6.2% | 4.6% |
| Standard Deviation (Population) | 6.1% | 4.6% |
Similar Demographics by Cognitive Disability
Demographics Similar to Colville by Cognitive Disability
In terms of cognitive disability, the demographic groups most similar to Colville are Seminole (18.3%, a difference of 0.010%), Ugandan (18.3%, a difference of 0.010%), Immigrants from Western Africa (18.4%, a difference of 0.10%), Immigrants from Eritrea (18.3%, a difference of 0.12%), and Immigrants from Eastern Africa (18.4%, a difference of 0.14%).
| Demographics | Rating | Rank | Cognitive Disability |
| Japanese | 0.0 /100 | #298 | Tragic 18.3% |
| Ghanaians | 0.0 /100 | #299 | Tragic 18.3% |
| Creek | 0.0 /100 | #300 | Tragic 18.3% |
| Immigrants | Ghana | 0.0 /100 | #301 | Tragic 18.3% |
| Barbadians | 0.0 /100 | #302 | Tragic 18.3% |
| Immigrants | Kenya | 0.0 /100 | #303 | Tragic 18.3% |
| Immigrants | Eritrea | 0.0 /100 | #304 | Tragic 18.3% |
| Colville | 0.0 /100 | #305 | Tragic 18.3% |
| Seminole | 0.0 /100 | #306 | Tragic 18.3% |
| Ugandans | 0.0 /100 | #307 | Tragic 18.3% |
| Immigrants | Western Africa | 0.0 /100 | #308 | Tragic 18.4% |
| Immigrants | Eastern Africa | 0.0 /100 | #309 | Tragic 18.4% |
| Choctaw | 0.0 /100 | #310 | Tragic 18.4% |
| Hmong | 0.0 /100 | #311 | Tragic 18.4% |
| Chickasaw | 0.0 /100 | #312 | Tragic 18.5% |
Demographics Similar to Delaware by Cognitive Disability
In terms of cognitive disability, the demographic groups most similar to Delaware are Immigrants from Haiti (17.4%, a difference of 0.050%), Nonimmigrants (17.4%, a difference of 0.060%), Immigrants from Spain (17.4%, a difference of 0.070%), Immigrants from Western Asia (17.4%, a difference of 0.14%), and Immigrants from Bosnia and Herzegovina (17.4%, a difference of 0.14%).
| Demographics | Rating | Rank | Cognitive Disability |
| Cambodians | 35.9 /100 | #186 | Fair 17.3% |
| Immigrants | Fiji | 33.7 /100 | #187 | Fair 17.4% |
| Immigrants | France | 29.8 /100 | #188 | Fair 17.4% |
| Immigrants | Western Asia | 29.5 /100 | #189 | Fair 17.4% |
| Immigrants | Spain | 27.7 /100 | #190 | Fair 17.4% |
| Immigrants | Nonimmigrants | 27.4 /100 | #191 | Fair 17.4% |
| Immigrants | Haiti | 27.1 /100 | #192 | Fair 17.4% |
| Delaware | 25.6 /100 | #193 | Fair 17.4% |
| Immigrants | Bosnia and Herzegovina | 22.0 /100 | #194 | Fair 17.4% |
| New Zealanders | 21.1 /100 | #195 | Fair 17.4% |
| Guyanese | 17.5 /100 | #196 | Poor 17.5% |
| Immigrants | Afghanistan | 16.7 /100 | #197 | Poor 17.5% |
| Immigrants | Panama | 14.8 /100 | #198 | Poor 17.5% |
| Immigrants | Singapore | 14.3 /100 | #199 | Poor 17.5% |
| Haitians | 14.1 /100 | #200 | Poor 17.5% |