Colville vs Immigrants from El Salvador Cognitive Disability
COMPARE
Colville
Immigrants from El Salvador
Cognitive Disability
Cognitive Disability Comparison
Colville
Immigrants from El Salvador
18.3%
COGNITIVE DISABILITY
0.0/ 100
METRIC RATING
305th/ 347
METRIC RANK
17.6%
COGNITIVE DISABILITY
7.0/ 100
METRIC RATING
214th/ 347
METRIC RANK
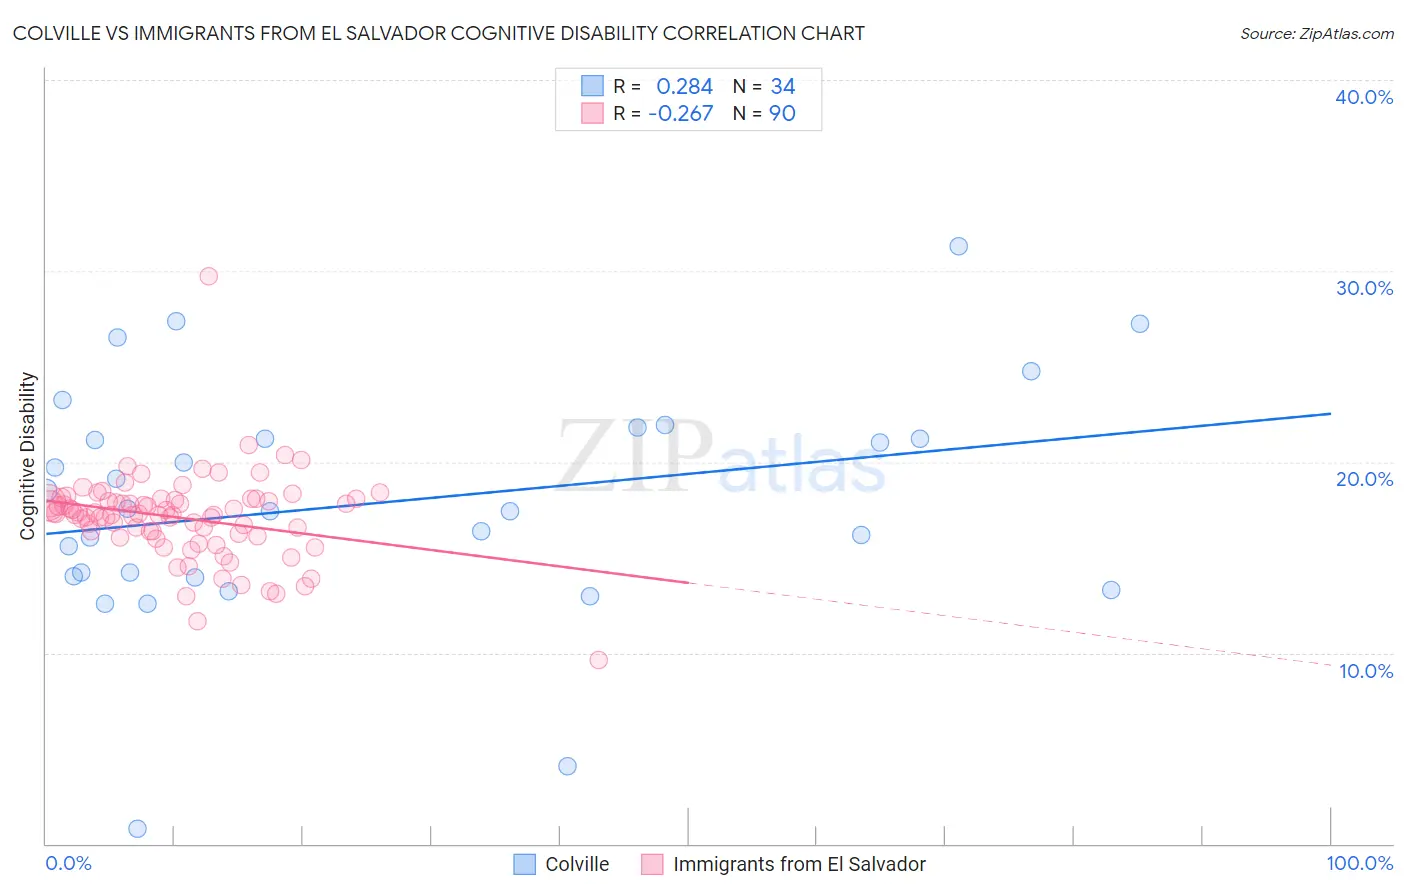
Colville vs Immigrants from El Salvador Cognitive Disability Correlation Chart
The statistical analysis conducted on geographies consisting of 34,687,480 people shows a weak positive correlation between the proportion of Colville and percentage of population with cognitive disability in the United States with a correlation coefficient (R) of 0.284 and weighted average of 18.3%. Similarly, the statistical analysis conducted on geographies consisting of 357,776,570 people shows a weak negative correlation between the proportion of Immigrants from El Salvador and percentage of population with cognitive disability in the United States with a correlation coefficient (R) of -0.267 and weighted average of 17.6%, a difference of 4.3%.
Cognitive Disability Correlation Summary
| Measurement | Colville | Immigrants from El Salvador |
| Minimum | 0.79% | 9.6% |
| Maximum | 31.3% | 29.7% |
| Range | 30.5% | 20.0% |
| Mean | 17.9% | 17.1% |
| Median | 17.5% | 17.3% |
| Interquartile 25% (IQ1) | 14.0% | 16.2% |
| Interquartile 75% (IQ3) | 21.2% | 18.0% |
| Interquartile Range (IQR) | 7.2% | 1.7% |
| Standard Deviation (Sample) | 6.2% | 2.3% |
| Standard Deviation (Population) | 6.1% | 2.3% |
Similar Demographics by Cognitive Disability
Demographics Similar to Colville by Cognitive Disability
In terms of cognitive disability, the demographic groups most similar to Colville are Seminole (18.3%, a difference of 0.010%), Ugandan (18.3%, a difference of 0.010%), Immigrants from Western Africa (18.4%, a difference of 0.10%), Immigrants from Eritrea (18.3%, a difference of 0.12%), and Immigrants from Eastern Africa (18.4%, a difference of 0.14%).
| Demographics | Rating | Rank | Cognitive Disability |
| Japanese | 0.0 /100 | #298 | Tragic 18.3% |
| Ghanaians | 0.0 /100 | #299 | Tragic 18.3% |
| Creek | 0.0 /100 | #300 | Tragic 18.3% |
| Immigrants | Ghana | 0.0 /100 | #301 | Tragic 18.3% |
| Barbadians | 0.0 /100 | #302 | Tragic 18.3% |
| Immigrants | Kenya | 0.0 /100 | #303 | Tragic 18.3% |
| Immigrants | Eritrea | 0.0 /100 | #304 | Tragic 18.3% |
| Colville | 0.0 /100 | #305 | Tragic 18.3% |
| Seminole | 0.0 /100 | #306 | Tragic 18.3% |
| Ugandans | 0.0 /100 | #307 | Tragic 18.3% |
| Immigrants | Western Africa | 0.0 /100 | #308 | Tragic 18.4% |
| Immigrants | Eastern Africa | 0.0 /100 | #309 | Tragic 18.4% |
| Choctaw | 0.0 /100 | #310 | Tragic 18.4% |
| Hmong | 0.0 /100 | #311 | Tragic 18.4% |
| Chickasaw | 0.0 /100 | #312 | Tragic 18.5% |
Demographics Similar to Immigrants from El Salvador by Cognitive Disability
In terms of cognitive disability, the demographic groups most similar to Immigrants from El Salvador are Alaskan Athabascan (17.6%, a difference of 0.010%), Hawaiian (17.6%, a difference of 0.020%), Okinawan (17.6%, a difference of 0.020%), Salvadoran (17.6%, a difference of 0.030%), and Immigrants from Oceania (17.6%, a difference of 0.040%).
| Demographics | Rating | Rank | Cognitive Disability |
| Immigrants | Latin America | 9.7 /100 | #207 | Tragic 17.6% |
| Immigrants | Cameroon | 9.3 /100 | #208 | Tragic 17.6% |
| Immigrants | Trinidad and Tobago | 8.7 /100 | #209 | Tragic 17.6% |
| Immigrants | Jamaica | 8.5 /100 | #210 | Tragic 17.6% |
| Taiwanese | 7.7 /100 | #211 | Tragic 17.6% |
| Immigrants | Oceania | 7.3 /100 | #212 | Tragic 17.6% |
| Hawaiians | 7.2 /100 | #213 | Tragic 17.6% |
| Immigrants | El Salvador | 7.0 /100 | #214 | Tragic 17.6% |
| Alaskan Athabascans | 6.9 /100 | #215 | Tragic 17.6% |
| Okinawans | 6.8 /100 | #216 | Tragic 17.6% |
| Salvadorans | 6.7 /100 | #217 | Tragic 17.6% |
| Icelanders | 6.4 /100 | #218 | Tragic 17.6% |
| Immigrants | Sierra Leone | 6.3 /100 | #219 | Tragic 17.6% |
| Zimbabweans | 6.1 /100 | #220 | Tragic 17.6% |
| Moroccans | 5.9 /100 | #221 | Tragic 17.6% |