Hopi vs Hmong Cognitive Disability
COMPARE
Hopi
Hmong
Cognitive Disability
Cognitive Disability Comparison
Hopi
Hmong
17.9%
COGNITIVE DISABILITY
0.6/ 100
METRIC RATING
253rd/ 347
METRIC RANK
18.4%
COGNITIVE DISABILITY
0.0/ 100
METRIC RATING
311th/ 347
METRIC RANK
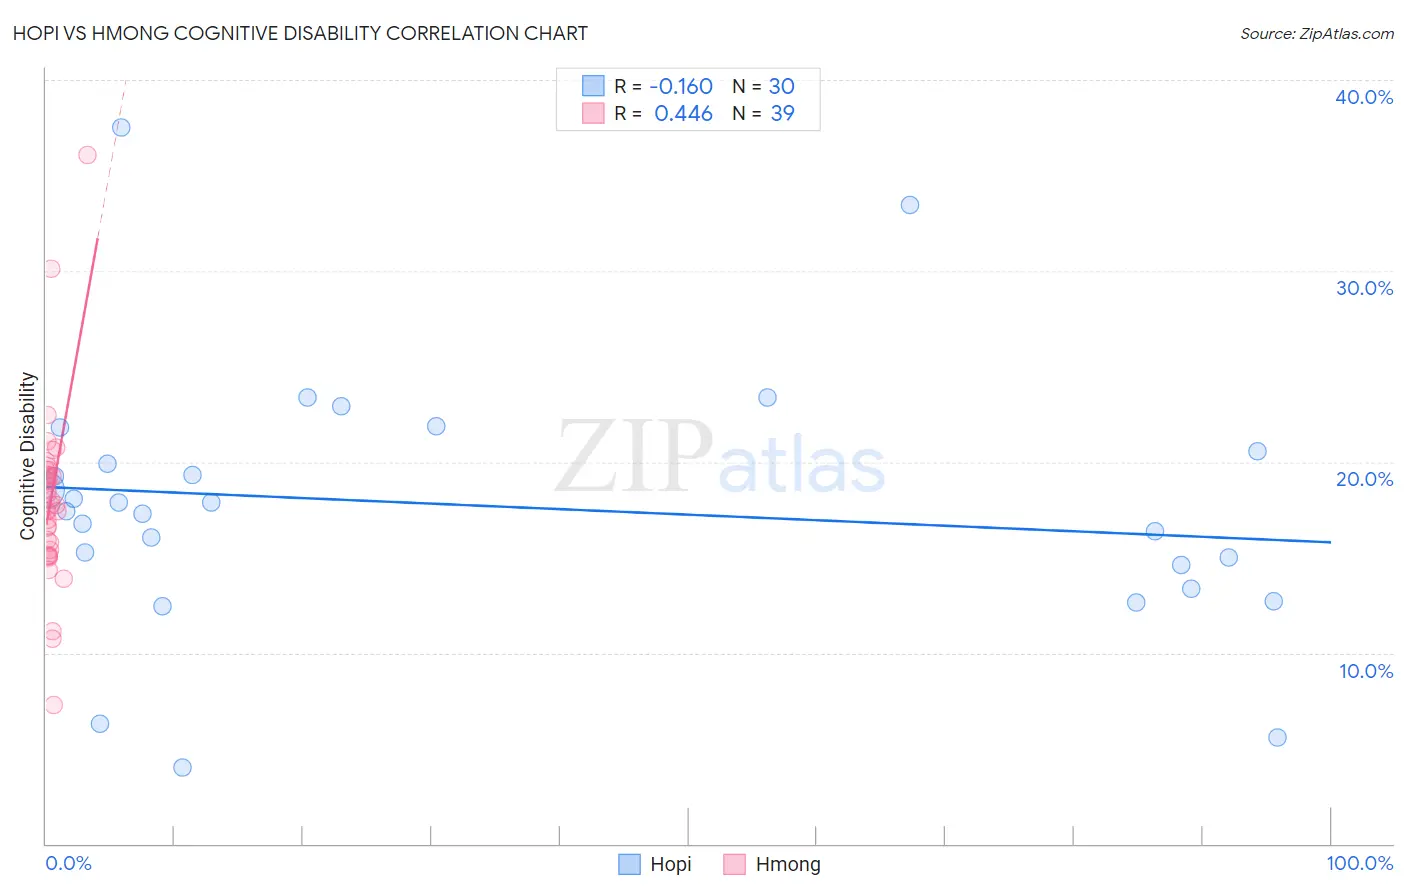
Hopi vs Hmong Cognitive Disability Correlation Chart
The statistical analysis conducted on geographies consisting of 74,733,532 people shows a poor negative correlation between the proportion of Hopi and percentage of population with cognitive disability in the United States with a correlation coefficient (R) of -0.160 and weighted average of 17.9%. Similarly, the statistical analysis conducted on geographies consisting of 24,607,802 people shows a moderate positive correlation between the proportion of Hmong and percentage of population with cognitive disability in the United States with a correlation coefficient (R) of 0.446 and weighted average of 18.4%, a difference of 3.0%.
Cognitive Disability Correlation Summary
| Measurement | Hopi | Hmong |
| Minimum | 4.0% | 7.3% |
| Maximum | 37.5% | 36.1% |
| Range | 33.5% | 28.8% |
| Mean | 17.7% | 18.0% |
| Median | 17.6% | 17.8% |
| Interquartile 25% (IQ1) | 14.6% | 15.4% |
| Interquartile 75% (IQ3) | 20.5% | 19.6% |
| Interquartile Range (IQR) | 6.0% | 4.2% |
| Standard Deviation (Sample) | 6.9% | 4.7% |
| Standard Deviation (Population) | 6.8% | 4.6% |
Similar Demographics by Cognitive Disability
Demographics Similar to Hopi by Cognitive Disability
In terms of cognitive disability, the demographic groups most similar to Hopi are Hispanic or Latino (17.9%, a difference of 0.0%), Immigrants from Grenada (17.9%, a difference of 0.010%), Immigrants from the Azores (17.9%, a difference of 0.010%), Bahamian (17.9%, a difference of 0.010%), and Cree (17.9%, a difference of 0.030%).
| Demographics | Rating | Rank | Cognitive Disability |
| Immigrants | Thailand | 0.8 /100 | #246 | Tragic 17.9% |
| Samoans | 0.7 /100 | #247 | Tragic 17.9% |
| French American Indians | 0.7 /100 | #248 | Tragic 17.9% |
| Cree | 0.7 /100 | #249 | Tragic 17.9% |
| Immigrants | Ethiopia | 0.7 /100 | #250 | Tragic 17.9% |
| Malaysians | 0.6 /100 | #251 | Tragic 17.9% |
| Immigrants | Grenada | 0.6 /100 | #252 | Tragic 17.9% |
| Hopi | 0.6 /100 | #253 | Tragic 17.9% |
| Hispanics or Latinos | 0.6 /100 | #254 | Tragic 17.9% |
| Immigrants | Azores | 0.6 /100 | #255 | Tragic 17.9% |
| Bahamians | 0.6 /100 | #256 | Tragic 17.9% |
| Mexican American Indians | 0.6 /100 | #257 | Tragic 17.9% |
| Immigrants | Armenia | 0.6 /100 | #258 | Tragic 17.9% |
| Ethiopians | 0.5 /100 | #259 | Tragic 17.9% |
| Immigrants | Belize | 0.5 /100 | #260 | Tragic 17.9% |
Demographics Similar to Hmong by Cognitive Disability
In terms of cognitive disability, the demographic groups most similar to Hmong are Choctaw (18.4%, a difference of 0.030%), Chickasaw (18.5%, a difference of 0.29%), Yaqui (18.5%, a difference of 0.39%), Immigrants from Eastern Africa (18.4%, a difference of 0.40%), and Immigrants from Western Africa (18.4%, a difference of 0.44%).
| Demographics | Rating | Rank | Cognitive Disability |
| Immigrants | Eritrea | 0.0 /100 | #304 | Tragic 18.3% |
| Colville | 0.0 /100 | #305 | Tragic 18.3% |
| Seminole | 0.0 /100 | #306 | Tragic 18.3% |
| Ugandans | 0.0 /100 | #307 | Tragic 18.3% |
| Immigrants | Western Africa | 0.0 /100 | #308 | Tragic 18.4% |
| Immigrants | Eastern Africa | 0.0 /100 | #309 | Tragic 18.4% |
| Choctaw | 0.0 /100 | #310 | Tragic 18.4% |
| Hmong | 0.0 /100 | #311 | Tragic 18.4% |
| Chickasaw | 0.0 /100 | #312 | Tragic 18.5% |
| Yaqui | 0.0 /100 | #313 | Tragic 18.5% |
| Sub-Saharan Africans | 0.0 /100 | #314 | Tragic 18.5% |
| Immigrants | Dominica | 0.0 /100 | #315 | Tragic 18.6% |
| Immigrants | Middle Africa | 0.0 /100 | #316 | Tragic 18.6% |
| Liberians | 0.0 /100 | #317 | Tragic 18.6% |
| Bangladeshis | 0.0 /100 | #318 | Tragic 18.6% |