Colville vs Marshallese Cognitive Disability
COMPARE
Colville
Marshallese
Cognitive Disability
Cognitive Disability Comparison
Colville
Marshallese
18.3%
COGNITIVE DISABILITY
0.0/ 100
METRIC RATING
305th/ 347
METRIC RANK
17.7%
COGNITIVE DISABILITY
2.7/ 100
METRIC RATING
226th/ 347
METRIC RANK
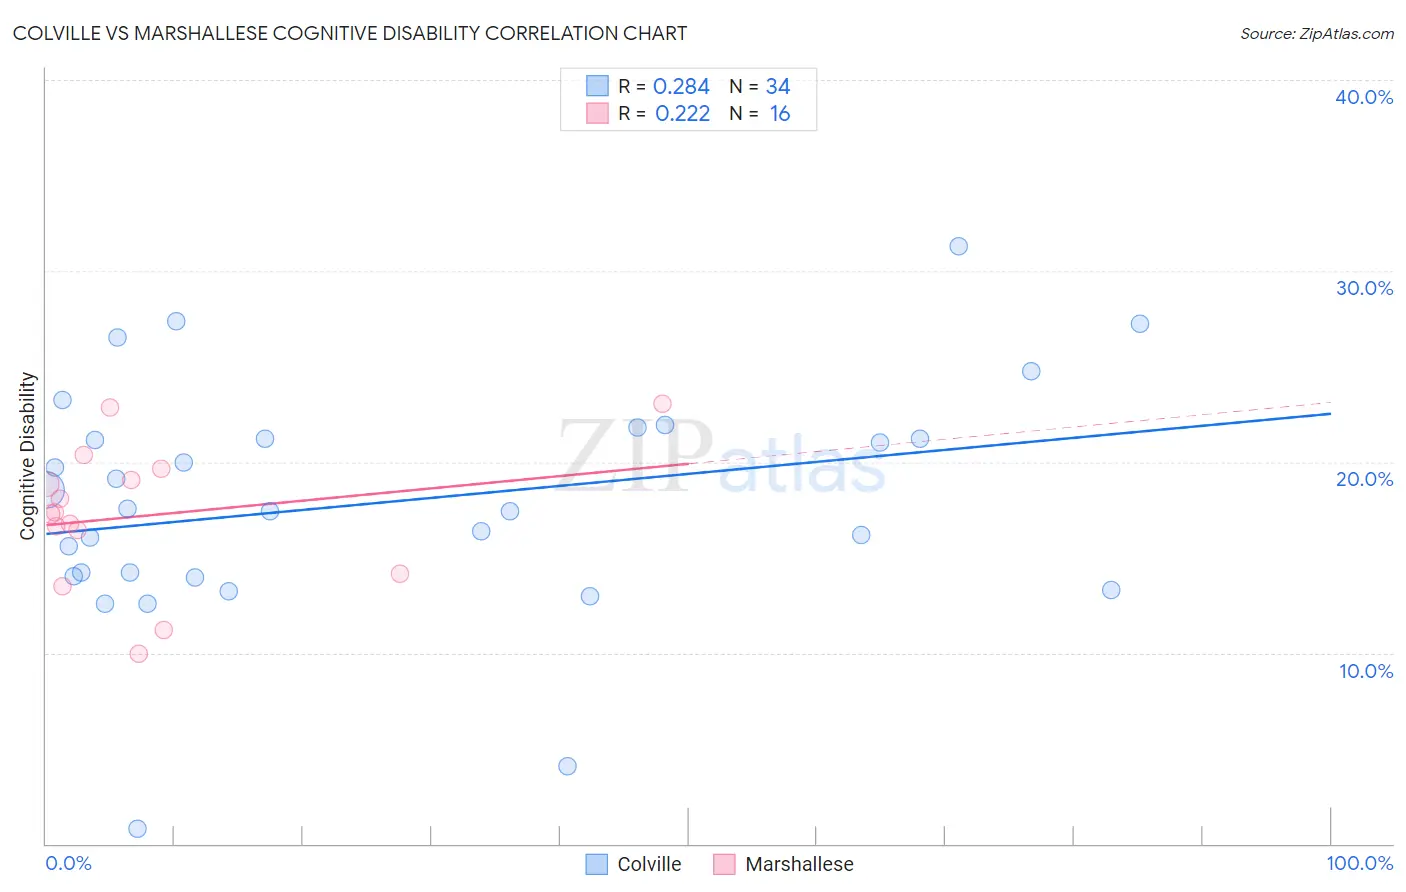
Colville vs Marshallese Cognitive Disability Correlation Chart
The statistical analysis conducted on geographies consisting of 34,687,480 people shows a weak positive correlation between the proportion of Colville and percentage of population with cognitive disability in the United States with a correlation coefficient (R) of 0.284 and weighted average of 18.3%. Similarly, the statistical analysis conducted on geographies consisting of 14,761,315 people shows a weak positive correlation between the proportion of Marshallese and percentage of population with cognitive disability in the United States with a correlation coefficient (R) of 0.222 and weighted average of 17.7%, a difference of 3.5%.
Cognitive Disability Correlation Summary
| Measurement | Colville | Marshallese |
| Minimum | 0.79% | 9.9% |
| Maximum | 31.3% | 23.1% |
| Range | 30.5% | 13.1% |
| Mean | 17.9% | 17.2% |
| Median | 17.5% | 17.3% |
| Interquartile 25% (IQ1) | 14.0% | 15.3% |
| Interquartile 75% (IQ3) | 21.2% | 19.3% |
| Interquartile Range (IQR) | 7.2% | 4.0% |
| Standard Deviation (Sample) | 6.2% | 3.7% |
| Standard Deviation (Population) | 6.1% | 3.6% |
Similar Demographics by Cognitive Disability
Demographics Similar to Colville by Cognitive Disability
In terms of cognitive disability, the demographic groups most similar to Colville are Seminole (18.3%, a difference of 0.010%), Ugandan (18.3%, a difference of 0.010%), Immigrants from Western Africa (18.4%, a difference of 0.10%), Immigrants from Eritrea (18.3%, a difference of 0.12%), and Immigrants from Eastern Africa (18.4%, a difference of 0.14%).
| Demographics | Rating | Rank | Cognitive Disability |
| Japanese | 0.0 /100 | #298 | Tragic 18.3% |
| Ghanaians | 0.0 /100 | #299 | Tragic 18.3% |
| Creek | 0.0 /100 | #300 | Tragic 18.3% |
| Immigrants | Ghana | 0.0 /100 | #301 | Tragic 18.3% |
| Barbadians | 0.0 /100 | #302 | Tragic 18.3% |
| Immigrants | Kenya | 0.0 /100 | #303 | Tragic 18.3% |
| Immigrants | Eritrea | 0.0 /100 | #304 | Tragic 18.3% |
| Colville | 0.0 /100 | #305 | Tragic 18.3% |
| Seminole | 0.0 /100 | #306 | Tragic 18.3% |
| Ugandans | 0.0 /100 | #307 | Tragic 18.3% |
| Immigrants | Western Africa | 0.0 /100 | #308 | Tragic 18.4% |
| Immigrants | Eastern Africa | 0.0 /100 | #309 | Tragic 18.4% |
| Choctaw | 0.0 /100 | #310 | Tragic 18.4% |
| Hmong | 0.0 /100 | #311 | Tragic 18.4% |
| Chickasaw | 0.0 /100 | #312 | Tragic 18.5% |
Demographics Similar to Marshallese by Cognitive Disability
In terms of cognitive disability, the demographic groups most similar to Marshallese are Immigrants from St. Vincent and the Grenadines (17.7%, a difference of 0.030%), Immigrants from Central America (17.7%, a difference of 0.11%), Immigrants from Guatemala (17.7%, a difference of 0.13%), Vietnamese (17.7%, a difference of 0.16%), and Mongolian (17.7%, a difference of 0.16%).
| Demographics | Rating | Rank | Cognitive Disability |
| Immigrants | Sierra Leone | 6.3 /100 | #219 | Tragic 17.6% |
| Zimbabweans | 6.1 /100 | #220 | Tragic 17.6% |
| Moroccans | 5.9 /100 | #221 | Tragic 17.6% |
| Central Americans | 4.5 /100 | #222 | Tragic 17.7% |
| Alsatians | 4.5 /100 | #223 | Tragic 17.7% |
| Fijians | 3.4 /100 | #224 | Tragic 17.7% |
| Vietnamese | 3.4 /100 | #225 | Tragic 17.7% |
| Marshallese | 2.7 /100 | #226 | Tragic 17.7% |
| Immigrants | St. Vincent and the Grenadines | 2.6 /100 | #227 | Tragic 17.7% |
| Immigrants | Central America | 2.3 /100 | #228 | Tragic 17.7% |
| Immigrants | Guatemala | 2.2 /100 | #229 | Tragic 17.7% |
| Mongolians | 2.2 /100 | #230 | Tragic 17.7% |
| Guatemalans | 2.1 /100 | #231 | Tragic 17.8% |
| Tongans | 2.1 /100 | #232 | Tragic 17.8% |
| Panamanians | 2.1 /100 | #233 | Tragic 17.8% |