Colville vs Nepalese Cognitive Disability
COMPARE
Colville
Nepalese
Cognitive Disability
Cognitive Disability Comparison
Colville
Nepalese
18.3%
COGNITIVE DISABILITY
0.0/ 100
METRIC RATING
305th/ 347
METRIC RANK
18.0%
COGNITIVE DISABILITY
0.3/ 100
METRIC RATING
267th/ 347
METRIC RANK
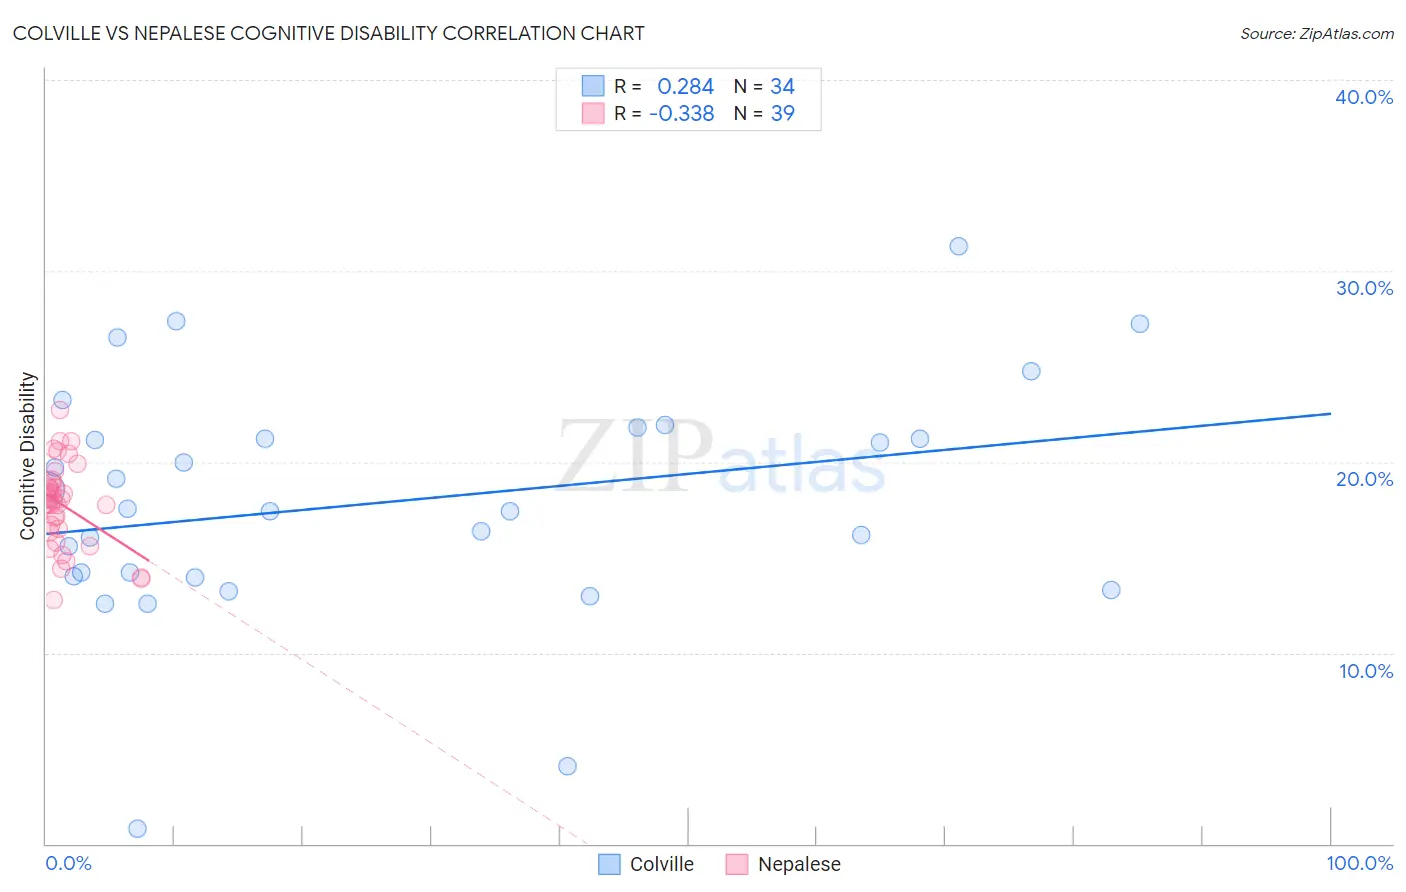
Colville vs Nepalese Cognitive Disability Correlation Chart
The statistical analysis conducted on geographies consisting of 34,687,480 people shows a weak positive correlation between the proportion of Colville and percentage of population with cognitive disability in the United States with a correlation coefficient (R) of 0.284 and weighted average of 18.3%. Similarly, the statistical analysis conducted on geographies consisting of 24,519,269 people shows a mild negative correlation between the proportion of Nepalese and percentage of population with cognitive disability in the United States with a correlation coefficient (R) of -0.338 and weighted average of 18.0%, a difference of 2.0%.
Cognitive Disability Correlation Summary
| Measurement | Colville | Nepalese |
| Minimum | 0.79% | 12.7% |
| Maximum | 31.3% | 22.7% |
| Range | 30.5% | 10.0% |
| Mean | 17.9% | 17.7% |
| Median | 17.5% | 18.0% |
| Interquartile 25% (IQ1) | 14.0% | 16.4% |
| Interquartile 75% (IQ3) | 21.2% | 18.9% |
| Interquartile Range (IQR) | 7.2% | 2.6% |
| Standard Deviation (Sample) | 6.2% | 2.2% |
| Standard Deviation (Population) | 6.1% | 2.2% |
Similar Demographics by Cognitive Disability
Demographics Similar to Colville by Cognitive Disability
In terms of cognitive disability, the demographic groups most similar to Colville are Seminole (18.3%, a difference of 0.010%), Ugandan (18.3%, a difference of 0.010%), Immigrants from Western Africa (18.4%, a difference of 0.10%), Immigrants from Eritrea (18.3%, a difference of 0.12%), and Immigrants from Eastern Africa (18.4%, a difference of 0.14%).
| Demographics | Rating | Rank | Cognitive Disability |
| Japanese | 0.0 /100 | #298 | Tragic 18.3% |
| Ghanaians | 0.0 /100 | #299 | Tragic 18.3% |
| Creek | 0.0 /100 | #300 | Tragic 18.3% |
| Immigrants | Ghana | 0.0 /100 | #301 | Tragic 18.3% |
| Barbadians | 0.0 /100 | #302 | Tragic 18.3% |
| Immigrants | Kenya | 0.0 /100 | #303 | Tragic 18.3% |
| Immigrants | Eritrea | 0.0 /100 | #304 | Tragic 18.3% |
| Colville | 0.0 /100 | #305 | Tragic 18.3% |
| Seminole | 0.0 /100 | #306 | Tragic 18.3% |
| Ugandans | 0.0 /100 | #307 | Tragic 18.3% |
| Immigrants | Western Africa | 0.0 /100 | #308 | Tragic 18.4% |
| Immigrants | Eastern Africa | 0.0 /100 | #309 | Tragic 18.4% |
| Choctaw | 0.0 /100 | #310 | Tragic 18.4% |
| Hmong | 0.0 /100 | #311 | Tragic 18.4% |
| Chickasaw | 0.0 /100 | #312 | Tragic 18.5% |
Demographics Similar to Nepalese by Cognitive Disability
In terms of cognitive disability, the demographic groups most similar to Nepalese are Cherokee (18.0%, a difference of 0.010%), Spanish American (18.0%, a difference of 0.060%), Belizean (18.0%, a difference of 0.060%), Menominee (18.0%, a difference of 0.090%), and Immigrants from Barbados (17.9%, a difference of 0.15%).
| Demographics | Rating | Rank | Cognitive Disability |
| Immigrants | Belize | 0.5 /100 | #260 | Tragic 17.9% |
| Guamanians/Chamorros | 0.5 /100 | #261 | Tragic 17.9% |
| Sierra Leoneans | 0.4 /100 | #262 | Tragic 17.9% |
| Immigrants | Barbados | 0.4 /100 | #263 | Tragic 17.9% |
| Menominee | 0.4 /100 | #264 | Tragic 18.0% |
| Spanish Americans | 0.4 /100 | #265 | Tragic 18.0% |
| Belizeans | 0.4 /100 | #266 | Tragic 18.0% |
| Nepalese | 0.3 /100 | #267 | Tragic 18.0% |
| Cherokee | 0.3 /100 | #268 | Tragic 18.0% |
| Hondurans | 0.3 /100 | #269 | Tragic 18.0% |
| Immigrants | Bahamas | 0.3 /100 | #270 | Tragic 18.0% |
| Potawatomi | 0.2 /100 | #271 | Tragic 18.0% |
| Immigrants | Honduras | 0.2 /100 | #272 | Tragic 18.0% |
| Immigrants | Nepal | 0.2 /100 | #273 | Tragic 18.0% |
| Immigrants | Nigeria | 0.2 /100 | #274 | Tragic 18.0% |