Immigrants from Europe vs Immigrants from West Indies Disability
COMPARE
Immigrants from Europe
Immigrants from West Indies
Disability
Disability Comparison
Immigrants from Europe
Immigrants from West Indies
11.4%
DISABILITY
90.4/ 100
METRIC RATING
128th/ 347
METRIC RANK
11.9%
DISABILITY
21.1/ 100
METRIC RATING
190th/ 347
METRIC RANK
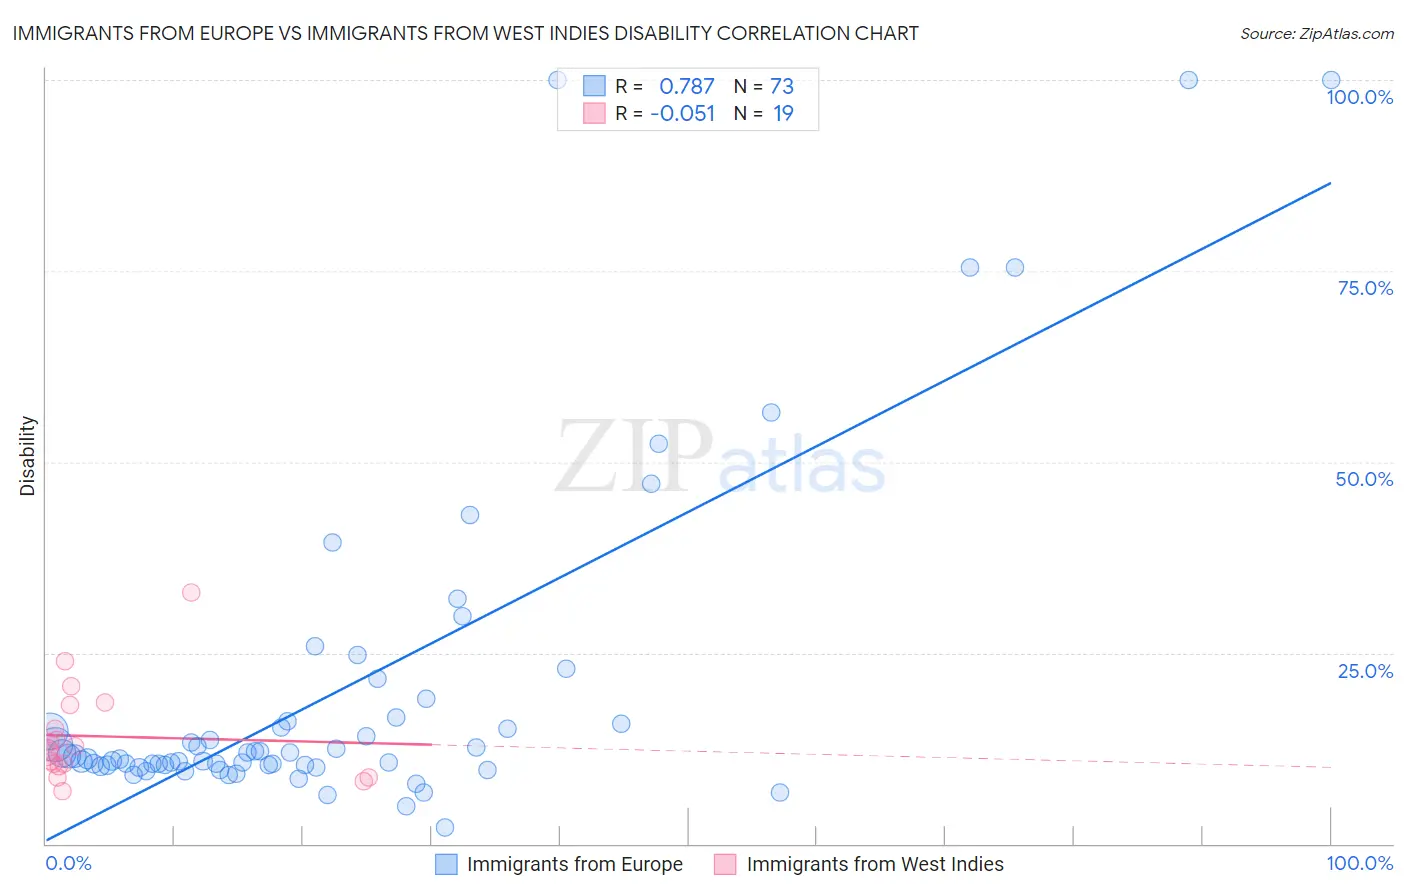
Immigrants from Europe vs Immigrants from West Indies Disability Correlation Chart
The statistical analysis conducted on geographies consisting of 547,337,167 people shows a strong positive correlation between the proportion of Immigrants from Europe and percentage of population with a disability in the United States with a correlation coefficient (R) of 0.787 and weighted average of 11.4%. Similarly, the statistical analysis conducted on geographies consisting of 72,456,461 people shows a slight negative correlation between the proportion of Immigrants from West Indies and percentage of population with a disability in the United States with a correlation coefficient (R) of -0.051 and weighted average of 11.9%, a difference of 4.0%.
Disability Correlation Summary
| Measurement | Immigrants from Europe | Immigrants from West Indies |
| Minimum | 2.1% | 6.9% |
| Maximum | 100.0% | 32.9% |
| Range | 97.9% | 26.0% |
| Mean | 20.2% | 14.1% |
| Median | 11.4% | 12.0% |
| Interquartile 25% (IQ1) | 10.2% | 10.1% |
| Interquartile 75% (IQ3) | 16.3% | 18.1% |
| Interquartile Range (IQR) | 6.0% | 8.0% |
| Standard Deviation (Sample) | 22.0% | 6.4% |
| Standard Deviation (Population) | 21.8% | 6.3% |
Similar Demographics by Disability
Demographics Similar to Immigrants from Europe by Disability
In terms of disability, the demographic groups most similar to Immigrants from Europe are Immigrants from Italy (11.4%, a difference of 0.0%), Macedonian (11.4%, a difference of 0.010%), Immigrants from Latvia (11.4%, a difference of 0.070%), Latvian (11.4%, a difference of 0.070%), and Immigrants from Croatia (11.4%, a difference of 0.080%).
| Demographics | Rating | Rank | Disability |
| Immigrants | Costa Rica | 93.4 /100 | #121 | Exceptional 11.4% |
| Brazilians | 93.3 /100 | #122 | Exceptional 11.4% |
| South Africans | 92.3 /100 | #123 | Exceptional 11.4% |
| South American Indians | 92.2 /100 | #124 | Exceptional 11.4% |
| Costa Ricans | 91.9 /100 | #125 | Exceptional 11.4% |
| Immigrants | Latvia | 90.9 /100 | #126 | Exceptional 11.4% |
| Immigrants | Italy | 90.4 /100 | #127 | Exceptional 11.4% |
| Immigrants | Europe | 90.4 /100 | #128 | Exceptional 11.4% |
| Macedonians | 90.3 /100 | #129 | Exceptional 11.4% |
| Latvians | 89.8 /100 | #130 | Excellent 11.4% |
| Immigrants | Croatia | 89.8 /100 | #131 | Excellent 11.4% |
| Immigrants | Africa | 89.3 /100 | #132 | Excellent 11.4% |
| Arabs | 89.1 /100 | #133 | Excellent 11.4% |
| Immigrants | Guyana | 88.3 /100 | #134 | Excellent 11.4% |
| Ugandans | 87.9 /100 | #135 | Excellent 11.4% |
Demographics Similar to Immigrants from West Indies by Disability
In terms of disability, the demographic groups most similar to Immigrants from West Indies are Immigrants from Zaire (11.9%, a difference of 0.050%), Ute (11.9%, a difference of 0.11%), Lithuanian (11.9%, a difference of 0.16%), Immigrants from Mexico (11.9%, a difference of 0.17%), and Immigrants from Bosnia and Herzegovina (11.9%, a difference of 0.21%).
| Demographics | Rating | Rank | Disability |
| Hondurans | 31.2 /100 | #183 | Fair 11.8% |
| Iraqis | 30.0 /100 | #184 | Fair 11.8% |
| Immigrants | Burma/Myanmar | 28.5 /100 | #185 | Fair 11.8% |
| Immigrants | Scotland | 28.2 /100 | #186 | Fair 11.8% |
| Lebanese | 27.9 /100 | #187 | Fair 11.8% |
| Immigrants | Mexico | 23.8 /100 | #188 | Fair 11.9% |
| Immigrants | Zaire | 21.8 /100 | #189 | Fair 11.9% |
| Immigrants | West Indies | 21.1 /100 | #190 | Fair 11.9% |
| Ute | 19.5 /100 | #191 | Poor 11.9% |
| Lithuanians | 18.8 /100 | #192 | Poor 11.9% |
| Immigrants | Bosnia and Herzegovina | 18.0 /100 | #193 | Poor 11.9% |
| Somalis | 17.3 /100 | #194 | Poor 11.9% |
| Barbadians | 15.8 /100 | #195 | Poor 11.9% |
| Serbians | 15.4 /100 | #196 | Poor 11.9% |
| Immigrants | Belize | 15.2 /100 | #197 | Poor 11.9% |