Pima vs Immigrants from West Indies Disability
COMPARE
Pima
Immigrants from West Indies
Disability
Disability Comparison
Pima
Immigrants from West Indies
13.7%
DISABILITY
0.0/ 100
METRIC RATING
316th/ 347
METRIC RANK
11.9%
DISABILITY
21.1/ 100
METRIC RATING
190th/ 347
METRIC RANK
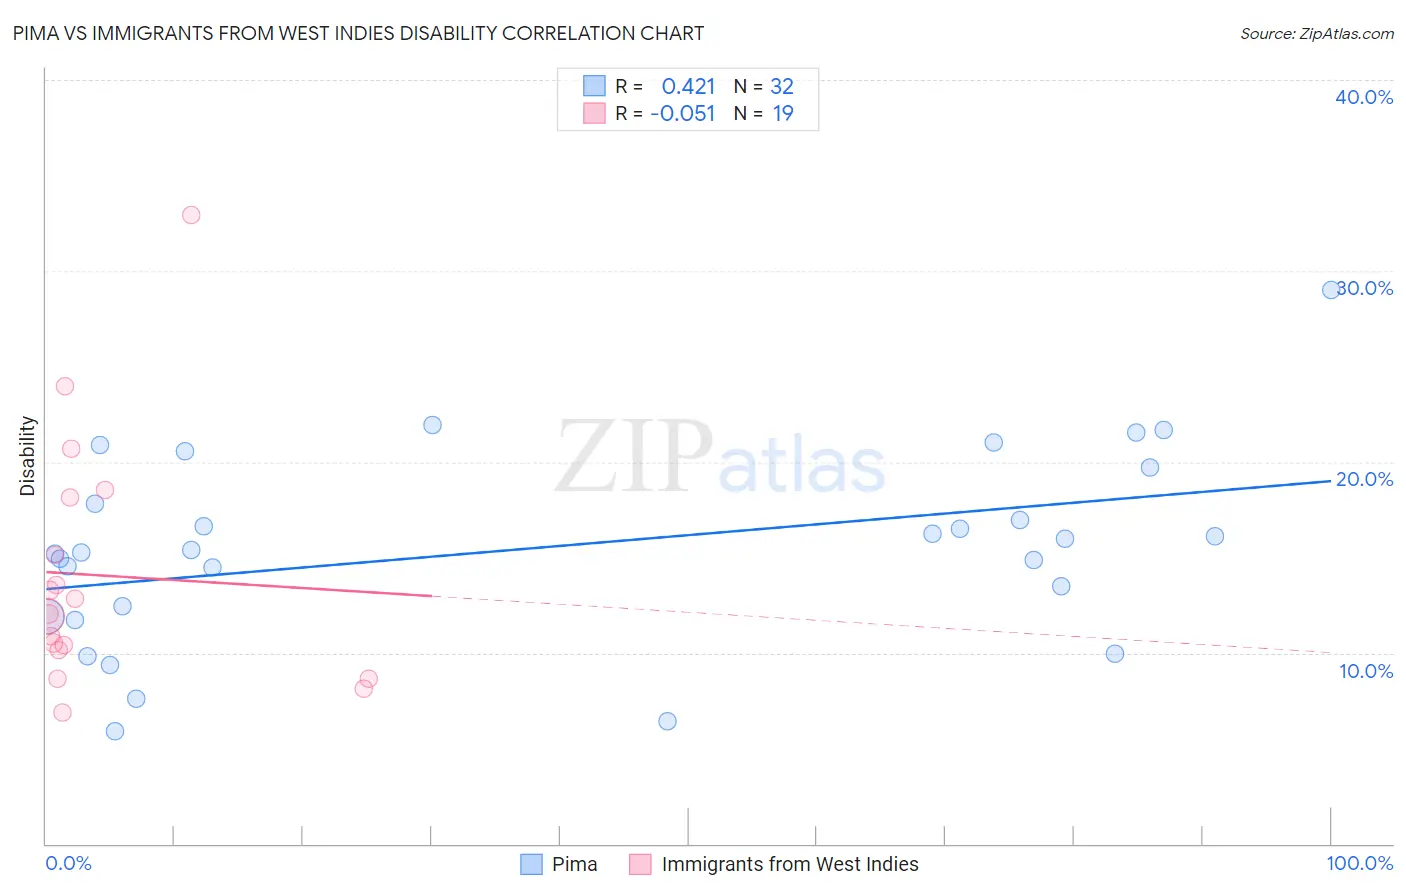
Pima vs Immigrants from West Indies Disability Correlation Chart
The statistical analysis conducted on geographies consisting of 61,542,416 people shows a moderate positive correlation between the proportion of Pima and percentage of population with a disability in the United States with a correlation coefficient (R) of 0.421 and weighted average of 13.7%. Similarly, the statistical analysis conducted on geographies consisting of 72,456,461 people shows a slight negative correlation between the proportion of Immigrants from West Indies and percentage of population with a disability in the United States with a correlation coefficient (R) of -0.051 and weighted average of 11.9%, a difference of 15.4%.
Disability Correlation Summary
| Measurement | Pima | Immigrants from West Indies |
| Minimum | 5.9% | 6.9% |
| Maximum | 29.0% | 32.9% |
| Range | 23.1% | 26.0% |
| Mean | 15.5% | 14.1% |
| Median | 15.3% | 12.0% |
| Interquartile 25% (IQ1) | 12.2% | 10.1% |
| Interquartile 75% (IQ3) | 18.7% | 18.1% |
| Interquartile Range (IQR) | 6.5% | 8.0% |
| Standard Deviation (Sample) | 5.1% | 6.4% |
| Standard Deviation (Population) | 5.0% | 6.3% |
Similar Demographics by Disability
Demographics Similar to Pima by Disability
In terms of disability, the demographic groups most similar to Pima are Immigrants from Cabo Verde (13.7%, a difference of 0.0%), Black/African American (13.7%, a difference of 0.030%), Puget Sound Salish (13.7%, a difference of 0.030%), Cree (13.7%, a difference of 0.070%), and Spanish American (13.6%, a difference of 0.42%).
| Demographics | Rating | Rank | Disability |
| Tlingit-Haida | 0.0 /100 | #309 | Tragic 13.5% |
| Blackfeet | 0.0 /100 | #310 | Tragic 13.6% |
| Delaware | 0.0 /100 | #311 | Tragic 13.6% |
| Spanish Americans | 0.0 /100 | #312 | Tragic 13.6% |
| Cree | 0.0 /100 | #313 | Tragic 13.7% |
| Blacks/African Americans | 0.0 /100 | #314 | Tragic 13.7% |
| Puget Sound Salish | 0.0 /100 | #315 | Tragic 13.7% |
| Pima | 0.0 /100 | #316 | Tragic 13.7% |
| Immigrants | Cabo Verde | 0.0 /100 | #317 | Tragic 13.7% |
| Menominee | 0.0 /100 | #318 | Tragic 13.8% |
| Iroquois | 0.0 /100 | #319 | Tragic 13.8% |
| Apache | 0.0 /100 | #320 | Tragic 13.9% |
| Paiute | 0.0 /100 | #321 | Tragic 13.9% |
| Americans | 0.0 /100 | #322 | Tragic 13.9% |
| Comanche | 0.0 /100 | #323 | Tragic 14.1% |
Demographics Similar to Immigrants from West Indies by Disability
In terms of disability, the demographic groups most similar to Immigrants from West Indies are Immigrants from Zaire (11.9%, a difference of 0.050%), Ute (11.9%, a difference of 0.11%), Lithuanian (11.9%, a difference of 0.16%), Immigrants from Mexico (11.9%, a difference of 0.17%), and Immigrants from Bosnia and Herzegovina (11.9%, a difference of 0.21%).
| Demographics | Rating | Rank | Disability |
| Hondurans | 31.2 /100 | #183 | Fair 11.8% |
| Iraqis | 30.0 /100 | #184 | Fair 11.8% |
| Immigrants | Burma/Myanmar | 28.5 /100 | #185 | Fair 11.8% |
| Immigrants | Scotland | 28.2 /100 | #186 | Fair 11.8% |
| Lebanese | 27.9 /100 | #187 | Fair 11.8% |
| Immigrants | Mexico | 23.8 /100 | #188 | Fair 11.9% |
| Immigrants | Zaire | 21.8 /100 | #189 | Fair 11.9% |
| Immigrants | West Indies | 21.1 /100 | #190 | Fair 11.9% |
| Ute | 19.5 /100 | #191 | Poor 11.9% |
| Lithuanians | 18.8 /100 | #192 | Poor 11.9% |
| Immigrants | Bosnia and Herzegovina | 18.0 /100 | #193 | Poor 11.9% |
| Somalis | 17.3 /100 | #194 | Poor 11.9% |
| Barbadians | 15.8 /100 | #195 | Poor 11.9% |
| Serbians | 15.4 /100 | #196 | Poor 11.9% |
| Immigrants | Belize | 15.2 /100 | #197 | Poor 11.9% |