Trinidadian and Tobagonian vs Immigrants from West Indies Disability
COMPARE
Trinidadian and Tobagonian
Immigrants from West Indies
Disability
Disability Comparison
Trinidadians and Tobagonians
Immigrants from West Indies
11.7%
DISABILITY
52.7/ 100
METRIC RATING
172nd/ 347
METRIC RANK
11.9%
DISABILITY
21.1/ 100
METRIC RATING
190th/ 347
METRIC RANK
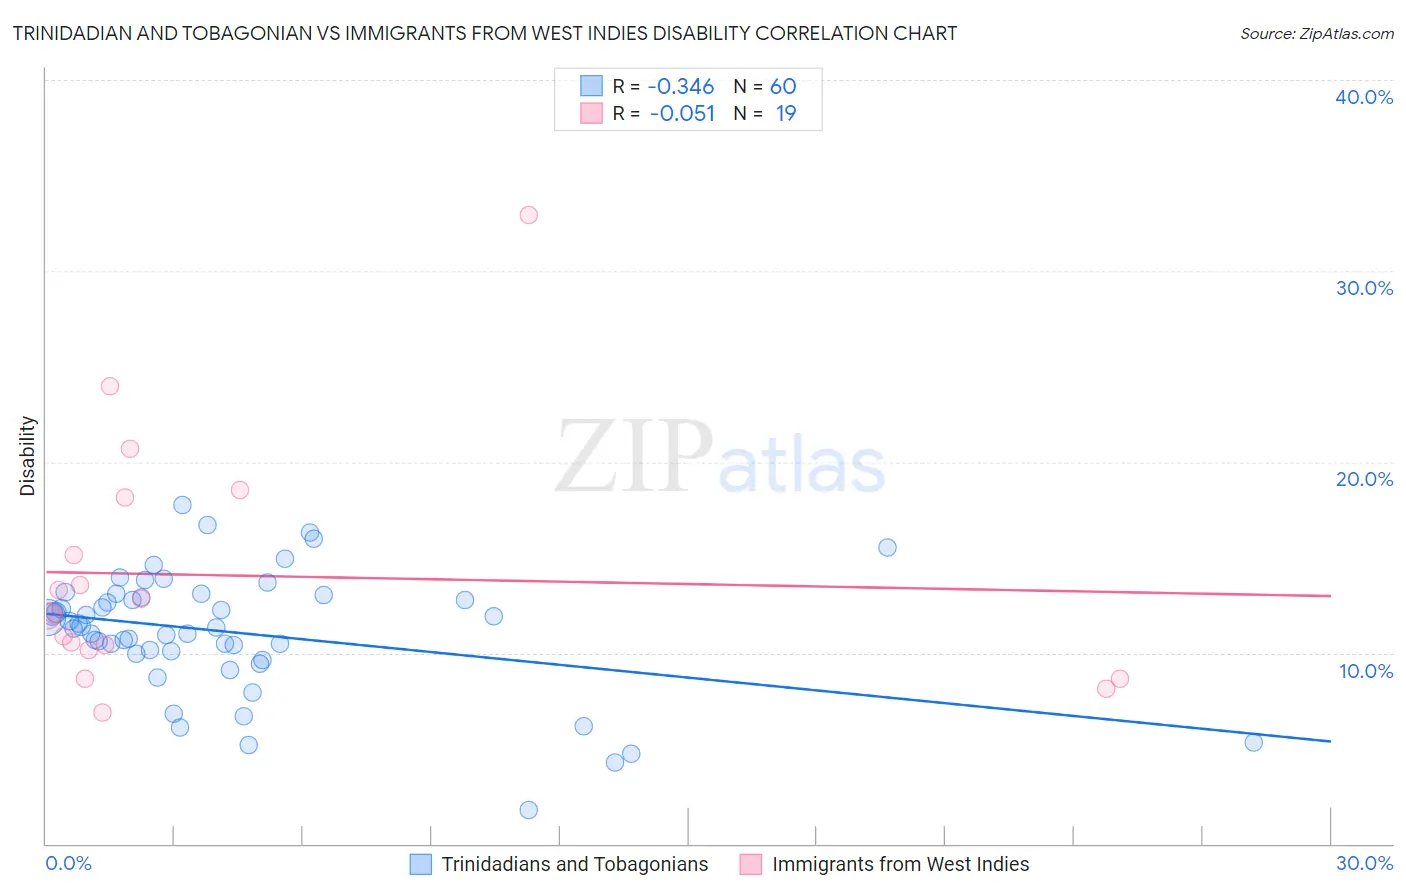
Trinidadian and Tobagonian vs Immigrants from West Indies Disability Correlation Chart
The statistical analysis conducted on geographies consisting of 219,849,540 people shows a mild negative correlation between the proportion of Trinidadians and Tobagonians and percentage of population with a disability in the United States with a correlation coefficient (R) of -0.346 and weighted average of 11.7%. Similarly, the statistical analysis conducted on geographies consisting of 72,456,461 people shows a slight negative correlation between the proportion of Immigrants from West Indies and percentage of population with a disability in the United States with a correlation coefficient (R) of -0.051 and weighted average of 11.9%, a difference of 1.6%.
Disability Correlation Summary
| Measurement | Trinidadian and Tobagonian | Immigrants from West Indies |
| Minimum | 1.7% | 6.9% |
| Maximum | 17.7% | 32.9% |
| Range | 16.0% | 26.0% |
| Mean | 11.1% | 14.1% |
| Median | 11.4% | 12.0% |
| Interquartile 25% (IQ1) | 10.0% | 10.1% |
| Interquartile 75% (IQ3) | 13.0% | 18.1% |
| Interquartile Range (IQR) | 2.9% | 8.0% |
| Standard Deviation (Sample) | 3.2% | 6.4% |
| Standard Deviation (Population) | 3.2% | 6.3% |
Demographics Similar to Trinidadians and Tobagonians and Immigrants from West Indies by Disability
In terms of disability, the demographic groups most similar to Trinidadians and Tobagonians are Immigrants from Southern Europe (11.7%, a difference of 0.010%), Maltese (11.7%, a difference of 0.090%), Albanian (11.7%, a difference of 0.12%), Haitian (11.7%, a difference of 0.18%), and Immigrants from Western Africa (11.7%, a difference of 0.23%). Similarly, the demographic groups most similar to Immigrants from West Indies are Immigrants from Zaire (11.9%, a difference of 0.050%), Ute (11.9%, a difference of 0.11%), Immigrants from Mexico (11.9%, a difference of 0.17%), Lebanese (11.8%, a difference of 0.40%), and Immigrants from Scotland (11.8%, a difference of 0.42%).
| Demographics | Rating | Rank | Disability |
| Immigrants | Southern Europe | 52.8 /100 | #171 | Average 11.7% |
| Trinidadians and Tobagonians | 52.7 /100 | #172 | Average 11.7% |
| Maltese | 50.6 /100 | #173 | Average 11.7% |
| Albanians | 50.0 /100 | #174 | Average 11.7% |
| Haitians | 48.6 /100 | #175 | Average 11.7% |
| Immigrants | Western Africa | 47.5 /100 | #176 | Average 11.7% |
| Immigrants | Central America | 46.6 /100 | #177 | Average 11.7% |
| Greeks | 46.2 /100 | #178 | Average 11.7% |
| Immigrants | Armenia | 41.9 /100 | #179 | Average 11.7% |
| Immigrants | Honduras | 37.8 /100 | #180 | Fair 11.8% |
| Immigrants | Oceania | 34.3 /100 | #181 | Fair 11.8% |
| Icelanders | 34.0 /100 | #182 | Fair 11.8% |
| Hondurans | 31.2 /100 | #183 | Fair 11.8% |
| Iraqis | 30.0 /100 | #184 | Fair 11.8% |
| Immigrants | Burma/Myanmar | 28.5 /100 | #185 | Fair 11.8% |
| Immigrants | Scotland | 28.2 /100 | #186 | Fair 11.8% |
| Lebanese | 27.9 /100 | #187 | Fair 11.8% |
| Immigrants | Mexico | 23.8 /100 | #188 | Fair 11.9% |
| Immigrants | Zaire | 21.8 /100 | #189 | Fair 11.9% |
| Immigrants | West Indies | 21.1 /100 | #190 | Fair 11.9% |
| Ute | 19.5 /100 | #191 | Poor 11.9% |