Chippewa vs Immigrants from Israel Disability
COMPARE
Chippewa
Immigrants from Israel
Disability
Disability Comparison
Chippewa
Immigrants from Israel
14.1%
DISABILITY
0.0/ 100
METRIC RATING
324th/ 347
METRIC RANK
10.1%
DISABILITY
100.0/ 100
METRIC RATING
12th/ 347
METRIC RANK
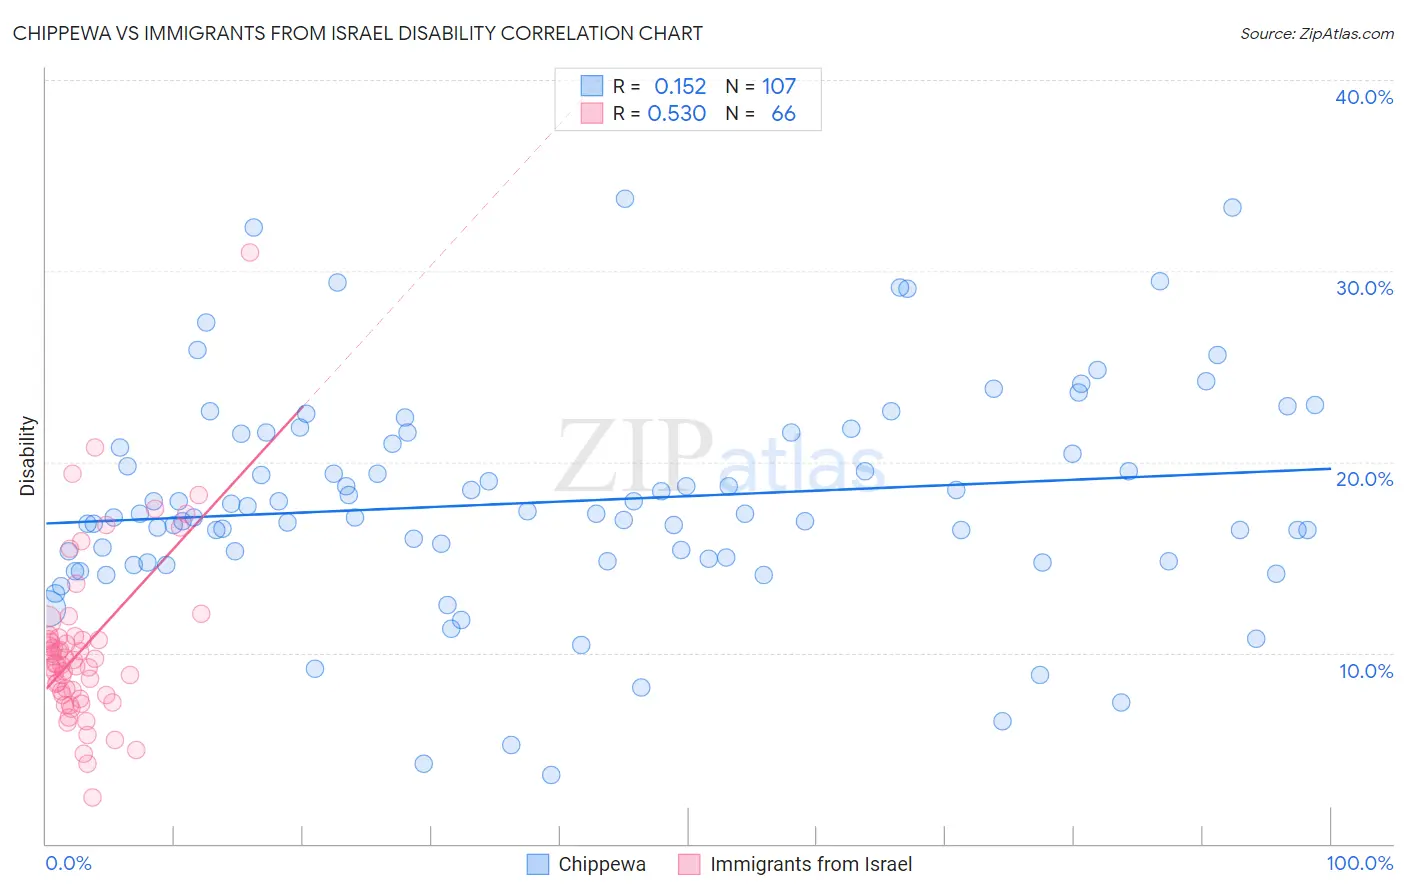
Chippewa vs Immigrants from Israel Disability Correlation Chart
The statistical analysis conducted on geographies consisting of 215,047,919 people shows a poor positive correlation between the proportion of Chippewa and percentage of population with a disability in the United States with a correlation coefficient (R) of 0.152 and weighted average of 14.1%. Similarly, the statistical analysis conducted on geographies consisting of 210,034,302 people shows a substantial positive correlation between the proportion of Immigrants from Israel and percentage of population with a disability in the United States with a correlation coefficient (R) of 0.530 and weighted average of 10.1%, a difference of 39.5%.
Disability Correlation Summary
| Measurement | Chippewa | Immigrants from Israel |
| Minimum | 3.6% | 2.4% |
| Maximum | 33.8% | 31.0% |
| Range | 30.2% | 28.5% |
| Mean | 17.9% | 10.3% |
| Median | 17.3% | 9.5% |
| Interquartile 25% (IQ1) | 14.8% | 7.8% |
| Interquartile 75% (IQ3) | 21.5% | 10.8% |
| Interquartile Range (IQR) | 6.7% | 3.0% |
| Standard Deviation (Sample) | 5.7% | 4.5% |
| Standard Deviation (Population) | 5.7% | 4.4% |
Similar Demographics by Disability
Demographics Similar to Chippewa by Disability
In terms of disability, the demographic groups most similar to Chippewa are Native/Alaskan (14.2%, a difference of 0.050%), Osage (14.2%, a difference of 0.080%), Ottawa (14.2%, a difference of 0.10%), Immigrants from the Azores (14.2%, a difference of 0.10%), and Comanche (14.1%, a difference of 0.20%).
| Demographics | Rating | Rank | Disability |
| Immigrants | Cabo Verde | 0.0 /100 | #317 | Tragic 13.7% |
| Menominee | 0.0 /100 | #318 | Tragic 13.8% |
| Iroquois | 0.0 /100 | #319 | Tragic 13.8% |
| Apache | 0.0 /100 | #320 | Tragic 13.9% |
| Paiute | 0.0 /100 | #321 | Tragic 13.9% |
| Americans | 0.0 /100 | #322 | Tragic 13.9% |
| Comanche | 0.0 /100 | #323 | Tragic 14.1% |
| Chippewa | 0.0 /100 | #324 | Tragic 14.1% |
| Natives/Alaskans | 0.0 /100 | #325 | Tragic 14.2% |
| Osage | 0.0 /100 | #326 | Tragic 14.2% |
| Ottawa | 0.0 /100 | #327 | Tragic 14.2% |
| Immigrants | Azores | 0.0 /100 | #328 | Tragic 14.2% |
| Potawatomi | 0.0 /100 | #329 | Tragic 14.2% |
| Navajo | 0.0 /100 | #330 | Tragic 14.3% |
| Alaskan Athabascans | 0.0 /100 | #331 | Tragic 14.4% |
Demographics Similar to Immigrants from Israel by Disability
In terms of disability, the demographic groups most similar to Immigrants from Israel are Immigrants from Eastern Asia (10.2%, a difference of 0.21%), Iranian (10.1%, a difference of 0.25%), Immigrants from China (10.1%, a difference of 0.26%), Immigrants from Korea (10.2%, a difference of 0.81%), and Immigrants from Hong Kong (10.0%, a difference of 1.1%).
| Demographics | Rating | Rank | Disability |
| Immigrants | Bolivia | 100.0 /100 | #5 | Exceptional 9.9% |
| Immigrants | South Central Asia | 100.0 /100 | #6 | Exceptional 9.9% |
| Immigrants | Singapore | 100.0 /100 | #7 | Exceptional 10.0% |
| Bolivians | 100.0 /100 | #8 | Exceptional 10.0% |
| Immigrants | Hong Kong | 100.0 /100 | #9 | Exceptional 10.0% |
| Immigrants | China | 100.0 /100 | #10 | Exceptional 10.1% |
| Iranians | 100.0 /100 | #11 | Exceptional 10.1% |
| Immigrants | Israel | 100.0 /100 | #12 | Exceptional 10.1% |
| Immigrants | Eastern Asia | 100.0 /100 | #13 | Exceptional 10.2% |
| Immigrants | Korea | 100.0 /100 | #14 | Exceptional 10.2% |
| Okinawans | 100.0 /100 | #15 | Exceptional 10.3% |
| Indians (Asian) | 100.0 /100 | #16 | Exceptional 10.3% |
| Immigrants | Iran | 100.0 /100 | #17 | Exceptional 10.3% |
| Burmese | 100.0 /100 | #18 | Exceptional 10.4% |
| Immigrants | Pakistan | 100.0 /100 | #19 | Exceptional 10.4% |