Tohono O'odham vs Immigrants from West Indies Disability
COMPARE
Tohono O'odham
Immigrants from West Indies
Disability
Disability Comparison
Tohono O'odham
Immigrants from West Indies
14.8%
DISABILITY
0.0/ 100
METRIC RATING
335th/ 347
METRIC RANK
11.9%
DISABILITY
21.1/ 100
METRIC RATING
190th/ 347
METRIC RANK
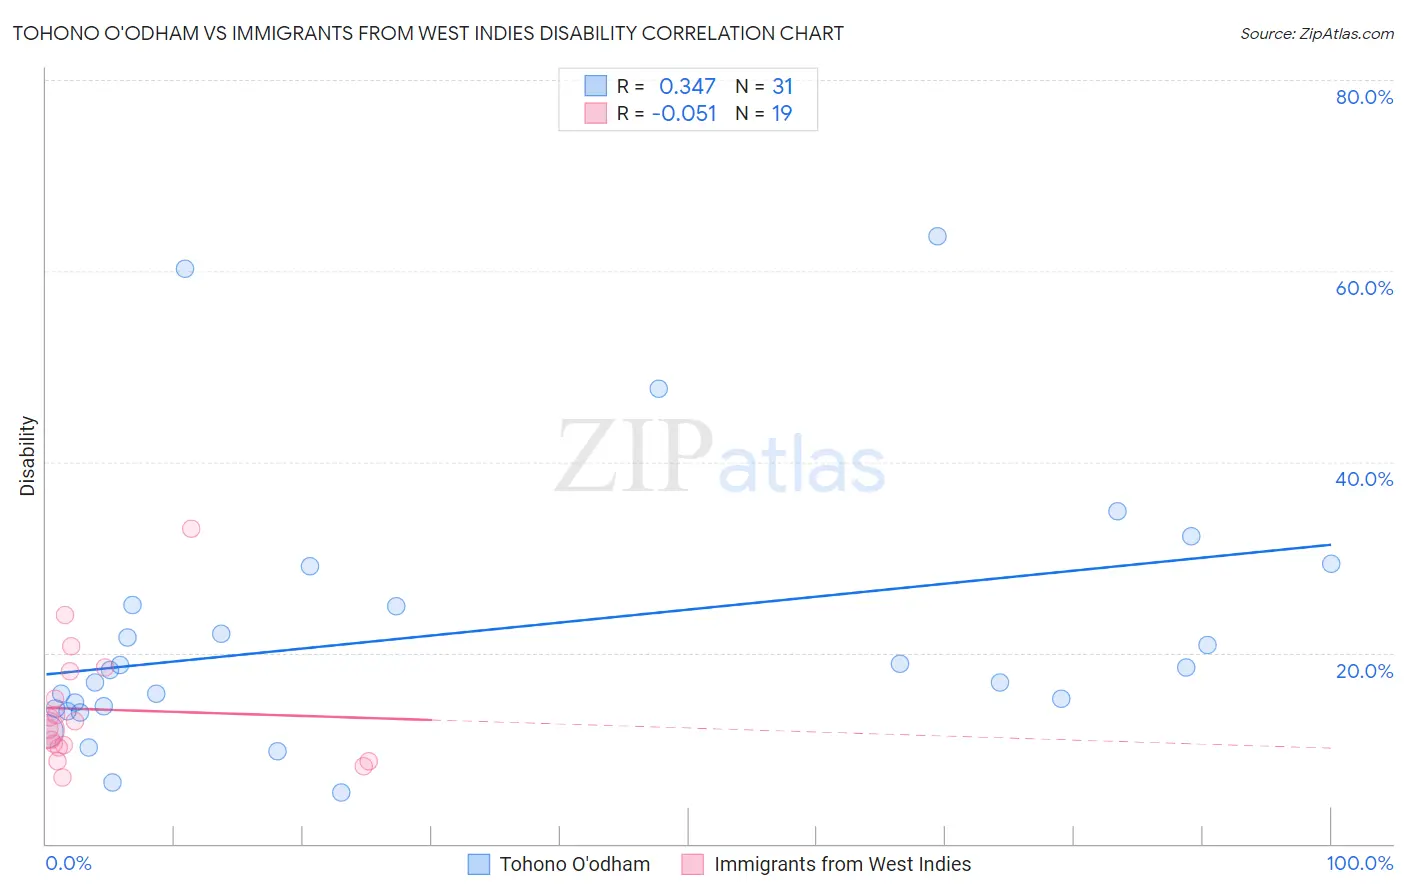
Tohono O'odham vs Immigrants from West Indies Disability Correlation Chart
The statistical analysis conducted on geographies consisting of 58,721,793 people shows a mild positive correlation between the proportion of Tohono O'odham and percentage of population with a disability in the United States with a correlation coefficient (R) of 0.347 and weighted average of 14.8%. Similarly, the statistical analysis conducted on geographies consisting of 72,456,461 people shows a slight negative correlation between the proportion of Immigrants from West Indies and percentage of population with a disability in the United States with a correlation coefficient (R) of -0.051 and weighted average of 11.9%, a difference of 24.4%.
Disability Correlation Summary
| Measurement | Tohono O'odham | Immigrants from West Indies |
| Minimum | 5.4% | 6.9% |
| Maximum | 63.6% | 32.9% |
| Range | 58.3% | 26.0% |
| Mean | 21.9% | 14.1% |
| Median | 18.2% | 12.0% |
| Interquartile 25% (IQ1) | 14.1% | 10.1% |
| Interquartile 75% (IQ3) | 25.0% | 18.1% |
| Interquartile Range (IQR) | 10.9% | 8.0% |
| Standard Deviation (Sample) | 13.8% | 6.4% |
| Standard Deviation (Population) | 13.5% | 6.3% |
Similar Demographics by Disability
Demographics Similar to Tohono O'odham by Disability
In terms of disability, the demographic groups most similar to Tohono O'odham are Cherokee (14.8%, a difference of 0.51%), Seminole (14.9%, a difference of 0.61%), Dutch West Indian (14.9%, a difference of 0.91%), Yuman (14.6%, a difference of 1.0%), and Cajun (14.6%, a difference of 1.2%).
| Demographics | Rating | Rank | Disability |
| Immigrants | Azores | 0.0 /100 | #328 | Tragic 14.2% |
| Potawatomi | 0.0 /100 | #329 | Tragic 14.2% |
| Navajo | 0.0 /100 | #330 | Tragic 14.3% |
| Alaskan Athabascans | 0.0 /100 | #331 | Tragic 14.4% |
| Pueblo | 0.0 /100 | #332 | Tragic 14.4% |
| Cajuns | 0.0 /100 | #333 | Tragic 14.6% |
| Yuman | 0.0 /100 | #334 | Tragic 14.6% |
| Tohono O'odham | 0.0 /100 | #335 | Tragic 14.8% |
| Cherokee | 0.0 /100 | #336 | Tragic 14.8% |
| Seminole | 0.0 /100 | #337 | Tragic 14.9% |
| Dutch West Indians | 0.0 /100 | #338 | Tragic 14.9% |
| Chickasaw | 0.0 /100 | #339 | Tragic 15.2% |
| Choctaw | 0.0 /100 | #340 | Tragic 15.4% |
| Lumbee | 0.0 /100 | #341 | Tragic 15.5% |
| Kiowa | 0.0 /100 | #342 | Tragic 15.6% |
Demographics Similar to Immigrants from West Indies by Disability
In terms of disability, the demographic groups most similar to Immigrants from West Indies are Immigrants from Zaire (11.9%, a difference of 0.050%), Ute (11.9%, a difference of 0.11%), Lithuanian (11.9%, a difference of 0.16%), Immigrants from Mexico (11.9%, a difference of 0.17%), and Immigrants from Bosnia and Herzegovina (11.9%, a difference of 0.21%).
| Demographics | Rating | Rank | Disability |
| Hondurans | 31.2 /100 | #183 | Fair 11.8% |
| Iraqis | 30.0 /100 | #184 | Fair 11.8% |
| Immigrants | Burma/Myanmar | 28.5 /100 | #185 | Fair 11.8% |
| Immigrants | Scotland | 28.2 /100 | #186 | Fair 11.8% |
| Lebanese | 27.9 /100 | #187 | Fair 11.8% |
| Immigrants | Mexico | 23.8 /100 | #188 | Fair 11.9% |
| Immigrants | Zaire | 21.8 /100 | #189 | Fair 11.9% |
| Immigrants | West Indies | 21.1 /100 | #190 | Fair 11.9% |
| Ute | 19.5 /100 | #191 | Poor 11.9% |
| Lithuanians | 18.8 /100 | #192 | Poor 11.9% |
| Immigrants | Bosnia and Herzegovina | 18.0 /100 | #193 | Poor 11.9% |
| Somalis | 17.3 /100 | #194 | Poor 11.9% |
| Barbadians | 15.8 /100 | #195 | Poor 11.9% |
| Serbians | 15.4 /100 | #196 | Poor 11.9% |
| Immigrants | Belize | 15.2 /100 | #197 | Poor 11.9% |