Chinese vs Immigrants from Italy Disability Age Under 5
COMPARE
Chinese
Immigrants from Italy
Disability Age Under 5
Disability Age Under 5 Comparison
Chinese
Immigrants from Italy
1.1%
DISABILITY AGE UNDER 5
97.2/ 100
METRIC RATING
90th/ 347
METRIC RANK
1.3%
DISABILITY AGE UNDER 5
25.4/ 100
METRIC RATING
201st/ 347
METRIC RANK
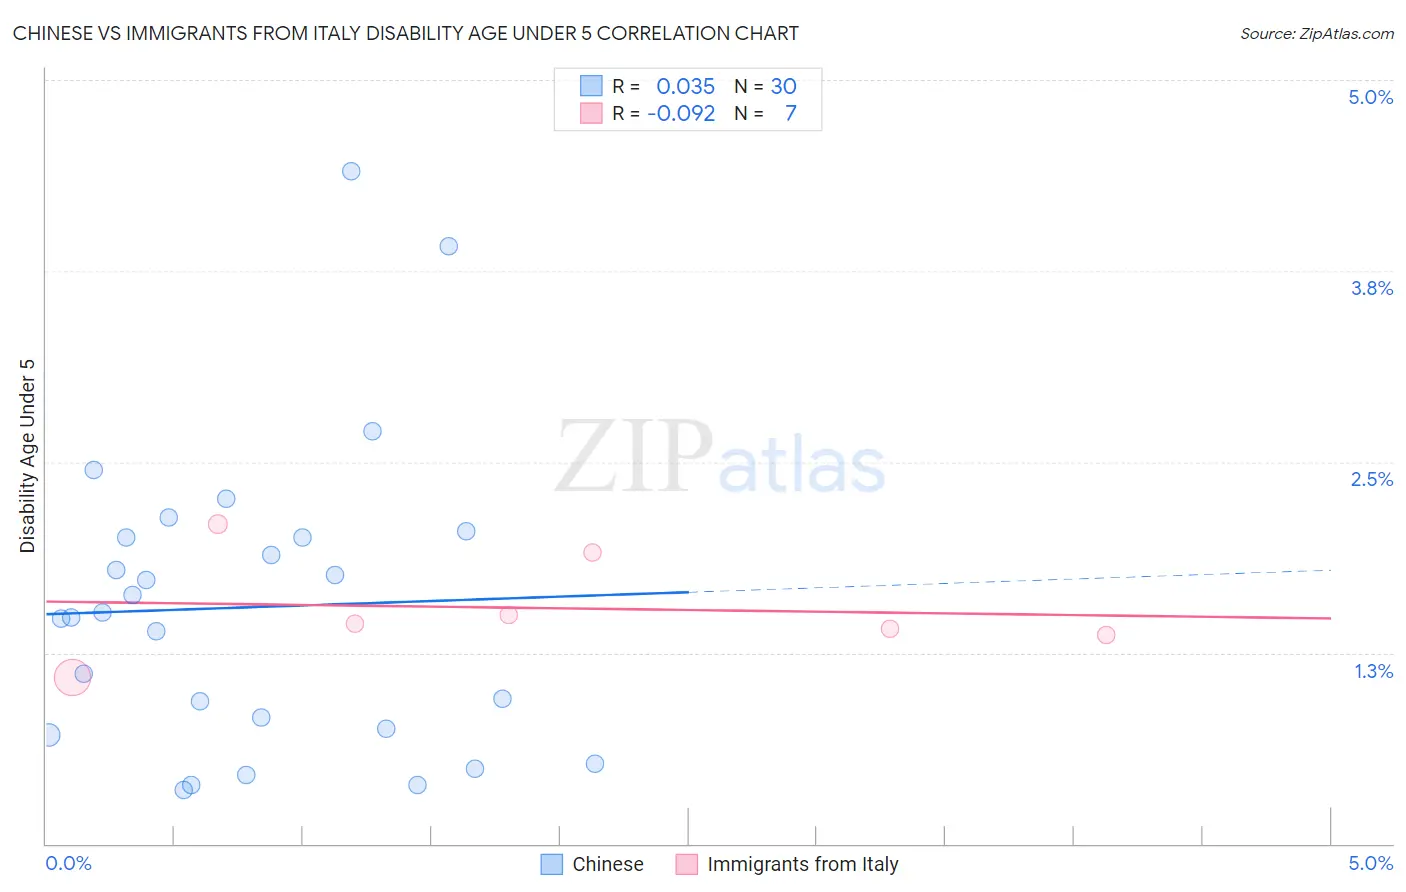
Chinese vs Immigrants from Italy Disability Age Under 5 Correlation Chart
The statistical analysis conducted on geographies consisting of 53,046,332 people shows no correlation between the proportion of Chinese and percentage of population with a disability under the age of 5 in the United States with a correlation coefficient (R) of 0.035 and weighted average of 1.1%. Similarly, the statistical analysis conducted on geographies consisting of 181,565,904 people shows a slight negative correlation between the proportion of Immigrants from Italy and percentage of population with a disability under the age of 5 in the United States with a correlation coefficient (R) of -0.092 and weighted average of 1.3%, a difference of 11.4%.
Disability Age Under 5 Correlation Summary
| Measurement | Chinese | Immigrants from Italy |
| Minimum | 0.35% | 1.1% |
| Maximum | 4.4% | 2.1% |
| Range | 4.0% | 1.0% |
| Mean | 1.5% | 1.5% |
| Median | 1.5% | 1.4% |
| Interquartile 25% (IQ1) | 0.75% | 1.4% |
| Interquartile 75% (IQ3) | 2.0% | 1.9% |
| Interquartile Range (IQR) | 1.3% | 0.54% |
| Standard Deviation (Sample) | 0.98% | 0.34% |
| Standard Deviation (Population) | 0.97% | 0.32% |
Similar Demographics by Disability Age Under 5
Demographics Similar to Chinese by Disability Age Under 5
In terms of disability age under 5, the demographic groups most similar to Chinese are Ethiopian (1.1%, a difference of 0.030%), Albanian (1.1%, a difference of 0.040%), Immigrants from Cuba (1.1%, a difference of 0.21%), Spanish American (1.1%, a difference of 0.24%), and Sri Lankan (1.1%, a difference of 0.30%).
| Demographics | Rating | Rank | Disability Age Under 5 |
| Immigrants | Syria | 97.9 /100 | #83 | Exceptional 1.1% |
| Immigrants | Zaire | 97.8 /100 | #84 | Exceptional 1.1% |
| Sudanese | 97.7 /100 | #85 | Exceptional 1.1% |
| Okinawans | 97.6 /100 | #86 | Exceptional 1.1% |
| Ugandans | 97.5 /100 | #87 | Exceptional 1.1% |
| Immigrants | Dominican Republic | 97.5 /100 | #88 | Exceptional 1.1% |
| Ethiopians | 97.2 /100 | #89 | Exceptional 1.1% |
| Chinese | 97.2 /100 | #90 | Exceptional 1.1% |
| Albanians | 97.2 /100 | #91 | Exceptional 1.1% |
| Immigrants | Cuba | 97.0 /100 | #92 | Exceptional 1.1% |
| Spanish Americans | 96.9 /100 | #93 | Exceptional 1.1% |
| Sri Lankans | 96.8 /100 | #94 | Exceptional 1.1% |
| Immigrants | Moldova | 96.8 /100 | #95 | Exceptional 1.1% |
| Mongolians | 96.6 /100 | #96 | Exceptional 1.1% |
| Immigrants | Iraq | 96.5 /100 | #97 | Exceptional 1.1% |
Demographics Similar to Immigrants from Italy by Disability Age Under 5
In terms of disability age under 5, the demographic groups most similar to Immigrants from Italy are Arapaho (1.3%, a difference of 0.15%), Liberian (1.3%, a difference of 0.16%), Immigrants from Lithuania (1.3%, a difference of 0.20%), Immigrants from Europe (1.3%, a difference of 0.21%), and Romanian (1.3%, a difference of 0.34%).
| Demographics | Rating | Rank | Disability Age Under 5 |
| Immigrants | North Macedonia | 34.7 /100 | #194 | Fair 1.3% |
| U.S. Virgin Islanders | 34.4 /100 | #195 | Fair 1.3% |
| Immigrants | Belgium | 31.4 /100 | #196 | Fair 1.3% |
| Immigrants | Somalia | 31.3 /100 | #197 | Fair 1.3% |
| Immigrants | Norway | 31.1 /100 | #198 | Fair 1.3% |
| Jamaicans | 30.7 /100 | #199 | Fair 1.3% |
| Immigrants | Lithuania | 27.2 /100 | #200 | Fair 1.3% |
| Immigrants | Italy | 25.4 /100 | #201 | Fair 1.3% |
| Arapaho | 24.1 /100 | #202 | Fair 1.3% |
| Liberians | 24.0 /100 | #203 | Fair 1.3% |
| Immigrants | Europe | 23.6 /100 | #204 | Fair 1.3% |
| Romanians | 22.5 /100 | #205 | Fair 1.3% |
| Immigrants | Poland | 22.4 /100 | #206 | Fair 1.3% |
| Nigerians | 21.2 /100 | #207 | Fair 1.3% |
| Mexicans | 20.8 /100 | #208 | Fair 1.3% |