Chinese vs South African Single Mother Poverty
COMPARE
Chinese
South African
Single Mother Poverty
Single Mother Poverty Comparison
Chinese
South Africans
24.6%
SINGLE MOTHER POVERTY
100.0/ 100
METRIC RATING
7th/ 347
METRIC RANK
28.5%
SINGLE MOTHER POVERTY
86.6/ 100
METRIC RATING
142nd/ 347
METRIC RANK
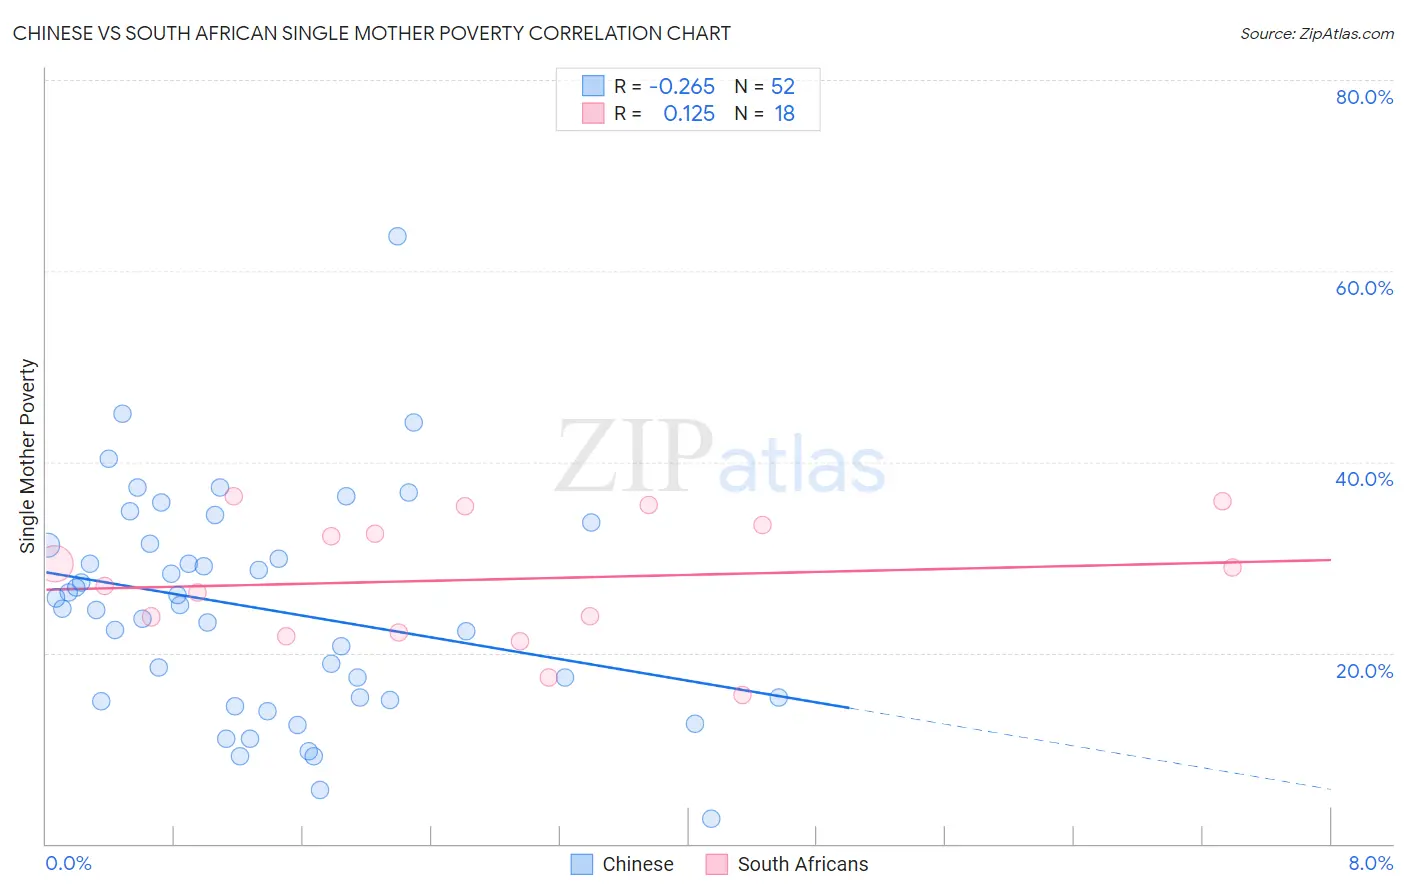
Chinese vs South African Single Mother Poverty Correlation Chart
The statistical analysis conducted on geographies consisting of 64,411,570 people shows a weak negative correlation between the proportion of Chinese and poverty level among single mothers in the United States with a correlation coefficient (R) of -0.265 and weighted average of 24.6%. Similarly, the statistical analysis conducted on geographies consisting of 179,638,644 people shows a poor positive correlation between the proportion of South Africans and poverty level among single mothers in the United States with a correlation coefficient (R) of 0.125 and weighted average of 28.5%, a difference of 15.8%.
Single Mother Poverty Correlation Summary
| Measurement | Chinese | South African |
| Minimum | 2.6% | 15.5% |
| Maximum | 63.6% | 36.4% |
| Range | 61.1% | 20.9% |
| Mean | 24.6% | 27.7% |
| Median | 24.8% | 28.0% |
| Interquartile 25% (IQ1) | 15.2% | 22.2% |
| Interquartile 75% (IQ3) | 31.4% | 33.3% |
| Interquartile Range (IQR) | 16.2% | 11.2% |
| Standard Deviation (Sample) | 11.6% | 6.6% |
| Standard Deviation (Population) | 11.4% | 6.4% |
Similar Demographics by Single Mother Poverty
Demographics Similar to Chinese by Single Mother Poverty
In terms of single mother poverty, the demographic groups most similar to Chinese are Thai (24.5%, a difference of 0.54%), Immigrants from Hong Kong (24.4%, a difference of 1.0%), Filipino (24.3%, a difference of 1.3%), Immigrants from Iran (25.1%, a difference of 2.0%), and Immigrants from Lithuania (25.2%, a difference of 2.4%).
| Demographics | Rating | Rank | Single Mother Poverty |
| Assyrians/Chaldeans/Syriacs | 100.0 /100 | #1 | Exceptional 23.8% |
| Immigrants | India | 100.0 /100 | #2 | Exceptional 23.8% |
| Immigrants | Taiwan | 100.0 /100 | #3 | Exceptional 23.9% |
| Filipinos | 100.0 /100 | #4 | Exceptional 24.3% |
| Immigrants | Hong Kong | 100.0 /100 | #5 | Exceptional 24.4% |
| Thais | 100.0 /100 | #6 | Exceptional 24.5% |
| Chinese | 100.0 /100 | #7 | Exceptional 24.6% |
| Immigrants | Iran | 100.0 /100 | #8 | Exceptional 25.1% |
| Immigrants | Lithuania | 100.0 /100 | #9 | Exceptional 25.2% |
| Immigrants | South Central Asia | 100.0 /100 | #10 | Exceptional 25.3% |
| Iranians | 100.0 /100 | #11 | Exceptional 25.5% |
| Bhutanese | 100.0 /100 | #12 | Exceptional 25.6% |
| Indians (Asian) | 100.0 /100 | #13 | Exceptional 25.8% |
| Immigrants | Singapore | 100.0 /100 | #14 | Exceptional 25.8% |
| Immigrants | Ireland | 100.0 /100 | #15 | Exceptional 25.8% |
Demographics Similar to South Africans by Single Mother Poverty
In terms of single mother poverty, the demographic groups most similar to South Africans are Immigrants from North America (28.5%, a difference of 0.010%), Luxembourger (28.5%, a difference of 0.020%), Danish (28.5%, a difference of 0.050%), Immigrants from South America (28.5%, a difference of 0.050%), and Immigrants from Denmark (28.5%, a difference of 0.060%).
| Demographics | Rating | Rank | Single Mother Poverty |
| Immigrants | Spain | 89.2 /100 | #135 | Excellent 28.4% |
| Native Hawaiians | 88.9 /100 | #136 | Excellent 28.4% |
| Immigrants | Canada | 88.9 /100 | #137 | Excellent 28.4% |
| Immigrants | Belgium | 88.5 /100 | #138 | Excellent 28.5% |
| Samoans | 88.1 /100 | #139 | Excellent 28.5% |
| Immigrants | Colombia | 88.0 /100 | #140 | Excellent 28.5% |
| Danes | 87.1 /100 | #141 | Excellent 28.5% |
| South Africans | 86.6 /100 | #142 | Excellent 28.5% |
| Immigrants | North America | 86.5 /100 | #143 | Excellent 28.5% |
| Luxembourgers | 86.4 /100 | #144 | Excellent 28.5% |
| Immigrants | South America | 86.1 /100 | #145 | Excellent 28.5% |
| Immigrants | Denmark | 86.1 /100 | #146 | Excellent 28.5% |
| Immigrants | Lebanon | 85.3 /100 | #147 | Excellent 28.6% |
| Syrians | 85.3 /100 | #148 | Excellent 28.6% |
| Serbians | 85.0 /100 | #149 | Excellent 28.6% |