Chinese vs South African Seniors Poverty Over the Age of 65
COMPARE
Chinese
South African
Seniors Poverty Over the Age of 65
Seniors Poverty Over the Age of 65 Comparison
Chinese
South Africans
8.3%
SENIORS POVERTY OVER THE AGE OF 65
100.0/ 100
METRIC RATING
1st/ 347
METRIC RANK
10.3%
SENIORS POVERTY OVER THE AGE OF 65
94.3/ 100
METRIC RATING
104th/ 347
METRIC RANK
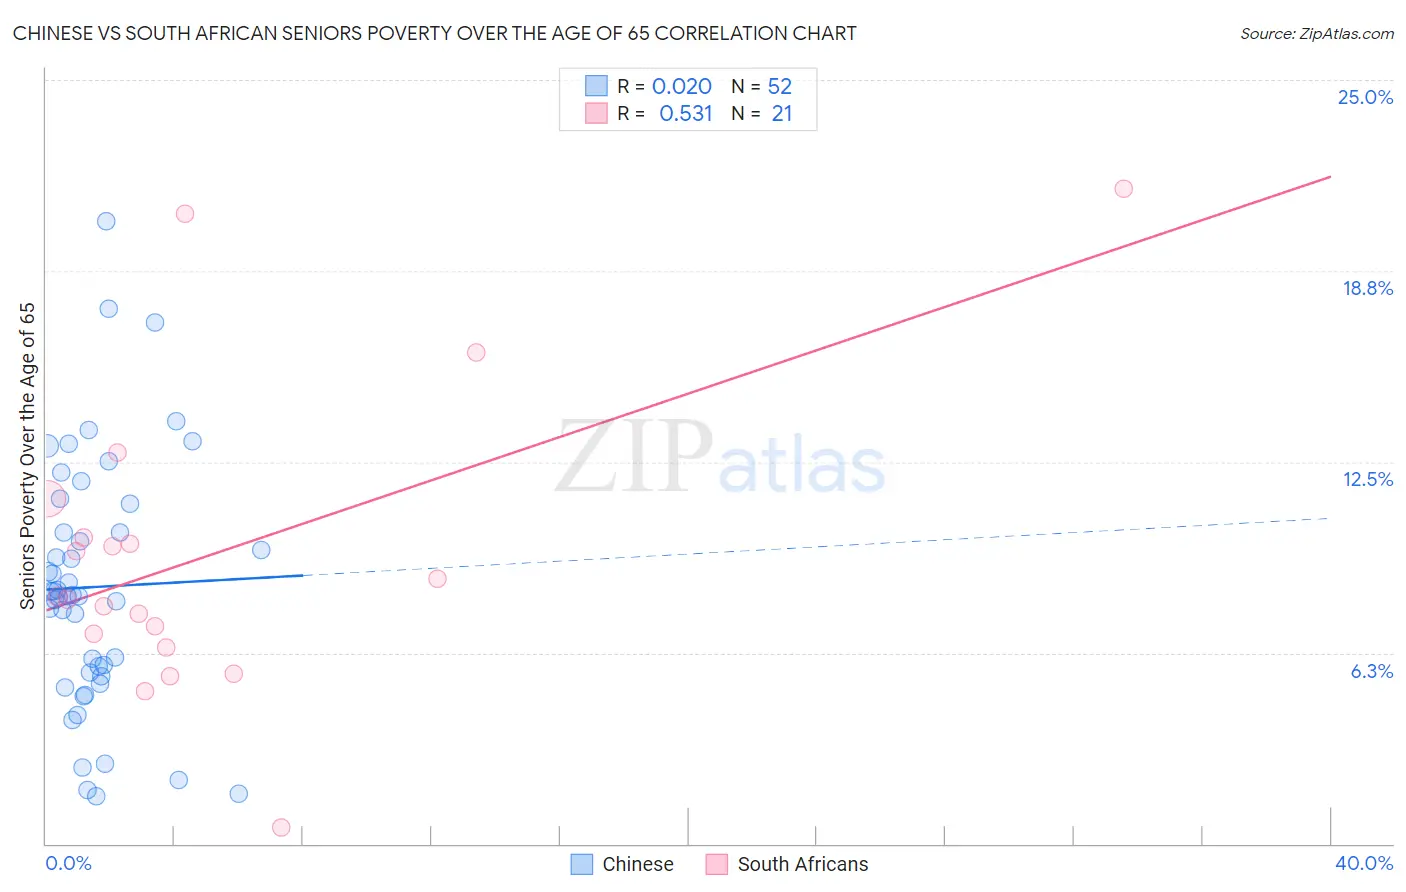
Chinese vs South African Seniors Poverty Over the Age of 65 Correlation Chart
The statistical analysis conducted on geographies consisting of 64,726,533 people shows no correlation between the proportion of Chinese and poverty level among seniors over the age of 65 in the United States with a correlation coefficient (R) of 0.020 and weighted average of 8.3%. Similarly, the statistical analysis conducted on geographies consisting of 182,245,174 people shows a substantial positive correlation between the proportion of South Africans and poverty level among seniors over the age of 65 in the United States with a correlation coefficient (R) of 0.531 and weighted average of 10.3%, a difference of 23.0%.
Seniors Poverty Over the Age of 65 Correlation Summary
| Measurement | Chinese | South African |
| Minimum | 1.5% | 0.52% |
| Maximum | 20.4% | 21.4% |
| Range | 18.8% | 20.9% |
| Mean | 8.4% | 9.4% |
| Median | 8.1% | 8.1% |
| Interquartile 25% (IQ1) | 5.5% | 6.7% |
| Interquartile 75% (IQ3) | 10.7% | 10.7% |
| Interquartile Range (IQR) | 5.1% | 4.0% |
| Standard Deviation (Sample) | 4.1% | 5.0% |
| Standard Deviation (Population) | 4.1% | 4.8% |
Similar Demographics by Seniors Poverty Over the Age of 65
Demographics Similar to Chinese by Seniors Poverty Over the Age of 65
In terms of seniors poverty over the age of 65, the demographic groups most similar to Chinese are Tlingit-Haida (8.3%, a difference of 0.15%), Norwegian (8.7%, a difference of 4.2%), Swedish (8.7%, a difference of 4.8%), Immigrants from India (8.8%, a difference of 5.2%), and Danish (8.8%, a difference of 5.7%).
| Demographics | Rating | Rank | Seniors Poverty Over the Age of 65 |
| Chinese | 100.0 /100 | #1 | Exceptional 8.3% |
| Tlingit-Haida | 100.0 /100 | #2 | Exceptional 8.3% |
| Norwegians | 100.0 /100 | #3 | Exceptional 8.7% |
| Swedes | 100.0 /100 | #4 | Exceptional 8.7% |
| Immigrants | India | 100.0 /100 | #5 | Exceptional 8.8% |
| Danes | 100.0 /100 | #6 | Exceptional 8.8% |
| Germans | 100.0 /100 | #7 | Exceptional 9.0% |
| Czechs | 100.0 /100 | #8 | Exceptional 9.0% |
| English | 100.0 /100 | #9 | Exceptional 9.1% |
| Lithuanians | 100.0 /100 | #10 | Exceptional 9.1% |
| Maltese | 99.9 /100 | #11 | Exceptional 9.1% |
| Scandinavians | 99.9 /100 | #12 | Exceptional 9.1% |
| Croatians | 99.9 /100 | #13 | Exceptional 9.1% |
| Poles | 99.9 /100 | #14 | Exceptional 9.1% |
| Dutch | 99.9 /100 | #15 | Exceptional 9.1% |
Demographics Similar to South Africans by Seniors Poverty Over the Age of 65
In terms of seniors poverty over the age of 65, the demographic groups most similar to South Africans are Icelander (10.3%, a difference of 0.040%), Aleut (10.3%, a difference of 0.070%), Delaware (10.2%, a difference of 0.090%), Kenyan (10.3%, a difference of 0.090%), and Hawaiian (10.3%, a difference of 0.16%).
| Demographics | Rating | Rank | Seniors Poverty Over the Age of 65 |
| Immigrants | Pakistan | 95.7 /100 | #97 | Exceptional 10.2% |
| Immigrants | Kuwait | 95.5 /100 | #98 | Exceptional 10.2% |
| Cypriots | 95.5 /100 | #99 | Exceptional 10.2% |
| Marshallese | 95.3 /100 | #100 | Exceptional 10.2% |
| Immigrants | Jordan | 94.7 /100 | #101 | Exceptional 10.2% |
| Delaware | 94.5 /100 | #102 | Exceptional 10.2% |
| Icelanders | 94.4 /100 | #103 | Exceptional 10.3% |
| South Africans | 94.3 /100 | #104 | Exceptional 10.3% |
| Aleuts | 94.1 /100 | #105 | Exceptional 10.3% |
| Kenyans | 94.1 /100 | #106 | Exceptional 10.3% |
| Hawaiians | 93.9 /100 | #107 | Exceptional 10.3% |
| Immigrants | Croatia | 93.9 /100 | #108 | Exceptional 10.3% |
| Syrians | 93.8 /100 | #109 | Exceptional 10.3% |
| Immigrants | Zimbabwe | 93.5 /100 | #110 | Exceptional 10.3% |
| Immigrants | Belgium | 93.4 /100 | #111 | Exceptional 10.3% |