Venezuelan vs Lithuanian Hearing Disability
COMPARE
Venezuelan
Lithuanian
Hearing Disability
Hearing Disability Comparison
Venezuelans
Lithuanians
2.6%
HEARING DISABILITY
99.4/ 100
METRIC RATING
45th/ 347
METRIC RANK
3.4%
HEARING DISABILITY
0.6/ 100
METRIC RATING
247th/ 347
METRIC RANK
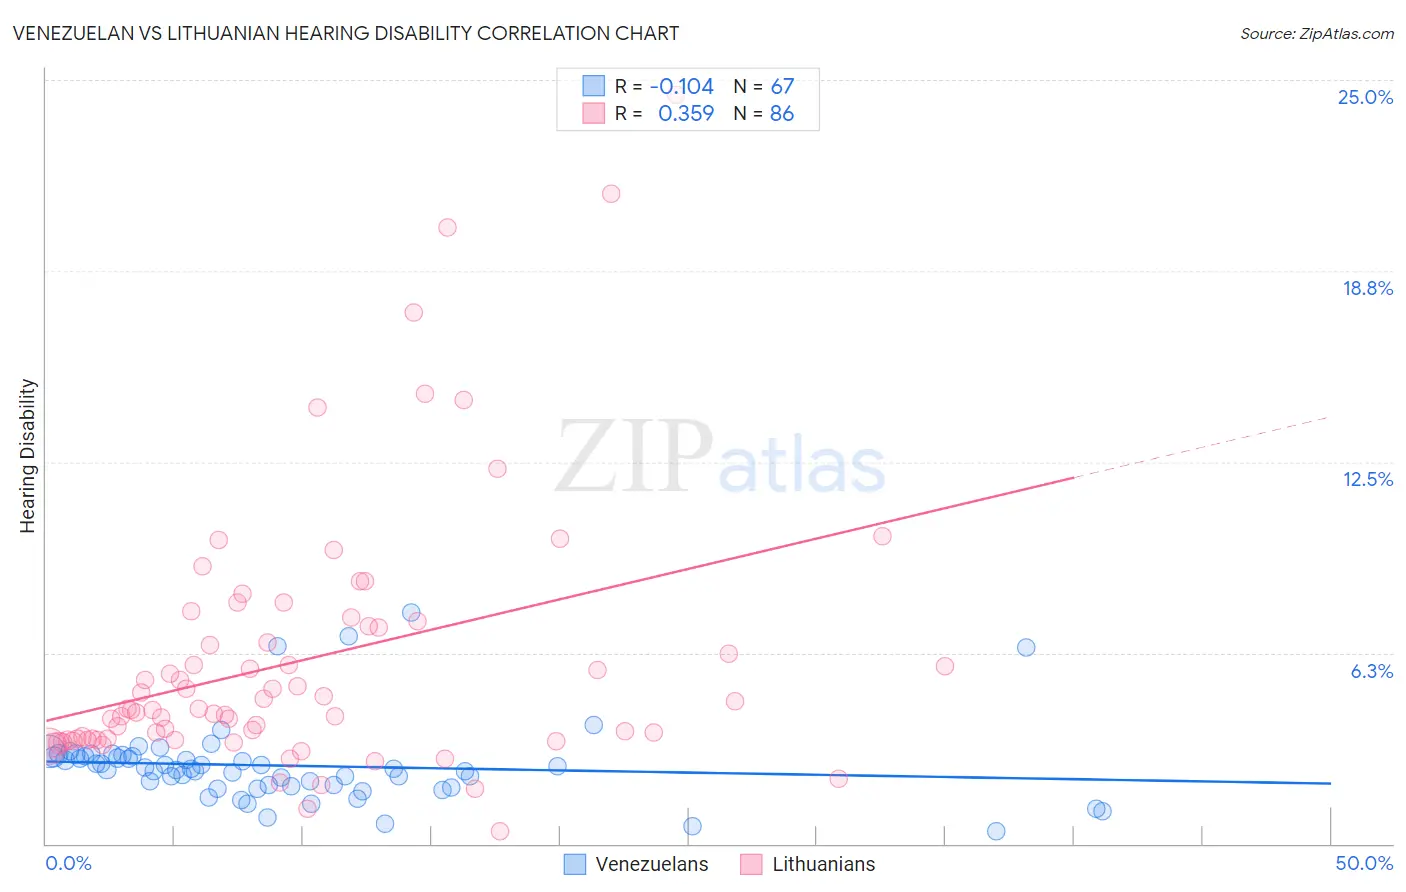
Venezuelan vs Lithuanian Hearing Disability Correlation Chart
The statistical analysis conducted on geographies consisting of 306,240,501 people shows a poor negative correlation between the proportion of Venezuelans and percentage of population with hearing disability in the United States with a correlation coefficient (R) of -0.104 and weighted average of 2.6%. Similarly, the statistical analysis conducted on geographies consisting of 421,806,281 people shows a mild positive correlation between the proportion of Lithuanians and percentage of population with hearing disability in the United States with a correlation coefficient (R) of 0.359 and weighted average of 3.4%, a difference of 26.9%.
Hearing Disability Correlation Summary
| Measurement | Venezuelan | Lithuanian |
| Minimum | 0.40% | 0.40% |
| Maximum | 7.6% | 24.5% |
| Range | 7.2% | 24.1% |
| Mean | 2.6% | 6.0% |
| Median | 2.4% | 4.4% |
| Interquartile 25% (IQ1) | 1.9% | 3.4% |
| Interquartile 75% (IQ3) | 2.9% | 7.1% |
| Interquartile Range (IQR) | 0.97% | 3.7% |
| Standard Deviation (Sample) | 1.3% | 4.4% |
| Standard Deviation (Population) | 1.3% | 4.3% |
Similar Demographics by Hearing Disability
Demographics Similar to Venezuelans by Hearing Disability
In terms of hearing disability, the demographic groups most similar to Venezuelans are Nigerian (2.6%, a difference of 0.020%), Immigrants from Dominica (2.6%, a difference of 0.10%), West Indian (2.6%, a difference of 0.25%), Senegalese (2.6%, a difference of 0.25%), and Immigrants from Israel (2.6%, a difference of 0.25%).
| Demographics | Rating | Rank | Hearing Disability |
| Immigrants | Jamaica | 99.5 /100 | #38 | Exceptional 2.6% |
| Immigrants | China | 99.5 /100 | #39 | Exceptional 2.6% |
| Haitians | 99.5 /100 | #40 | Exceptional 2.6% |
| Immigrants | Taiwan | 99.4 /100 | #41 | Exceptional 2.6% |
| West Indians | 99.4 /100 | #42 | Exceptional 2.6% |
| Senegalese | 99.4 /100 | #43 | Exceptional 2.6% |
| Nigerians | 99.4 /100 | #44 | Exceptional 2.6% |
| Venezuelans | 99.4 /100 | #45 | Exceptional 2.6% |
| Immigrants | Dominica | 99.3 /100 | #46 | Exceptional 2.6% |
| Immigrants | Israel | 99.3 /100 | #47 | Exceptional 2.6% |
| Immigrants | Singapore | 99.3 /100 | #48 | Exceptional 2.6% |
| Immigrants | South America | 99.2 /100 | #49 | Exceptional 2.7% |
| Paraguayans | 99.2 /100 | #50 | Exceptional 2.7% |
| Immigrants | Hong Kong | 99.2 /100 | #51 | Exceptional 2.7% |
| Jamaicans | 99.0 /100 | #52 | Exceptional 2.7% |
Demographics Similar to Lithuanians by Hearing Disability
In terms of hearing disability, the demographic groups most similar to Lithuanians are Immigrants from England (3.3%, a difference of 0.20%), Austrian (3.4%, a difference of 0.22%), Immigrants from Scotland (3.3%, a difference of 0.48%), Italian (3.4%, a difference of 0.75%), and Yuman (3.4%, a difference of 0.76%).
| Demographics | Rating | Rank | Hearing Disability |
| Immigrants | Netherlands | 1.1 /100 | #240 | Tragic 3.3% |
| Samoans | 1.1 /100 | #241 | Tragic 3.3% |
| Yugoslavians | 1.0 /100 | #242 | Tragic 3.3% |
| Immigrants | Western Europe | 1.0 /100 | #243 | Tragic 3.3% |
| Assyrians/Chaldeans/Syriacs | 0.9 /100 | #244 | Tragic 3.3% |
| Immigrants | Scotland | 0.8 /100 | #245 | Tragic 3.3% |
| Immigrants | England | 0.7 /100 | #246 | Tragic 3.3% |
| Lithuanians | 0.6 /100 | #247 | Tragic 3.4% |
| Austrians | 0.6 /100 | #248 | Tragic 3.4% |
| Italians | 0.4 /100 | #249 | Tragic 3.4% |
| Yuman | 0.4 /100 | #250 | Tragic 3.4% |
| Hungarians | 0.4 /100 | #251 | Tragic 3.4% |
| Croatians | 0.4 /100 | #252 | Tragic 3.4% |
| Carpatho Rusyns | 0.3 /100 | #253 | Tragic 3.4% |
| Slavs | 0.2 /100 | #254 | Tragic 3.4% |