Portuguese vs Lithuanian Hearing Disability
COMPARE
Portuguese
Lithuanian
Hearing Disability
Hearing Disability Comparison
Portuguese
Lithuanians
3.5%
HEARING DISABILITY
0.1/ 100
METRIC RATING
260th/ 347
METRIC RANK
3.4%
HEARING DISABILITY
0.6/ 100
METRIC RATING
247th/ 347
METRIC RANK
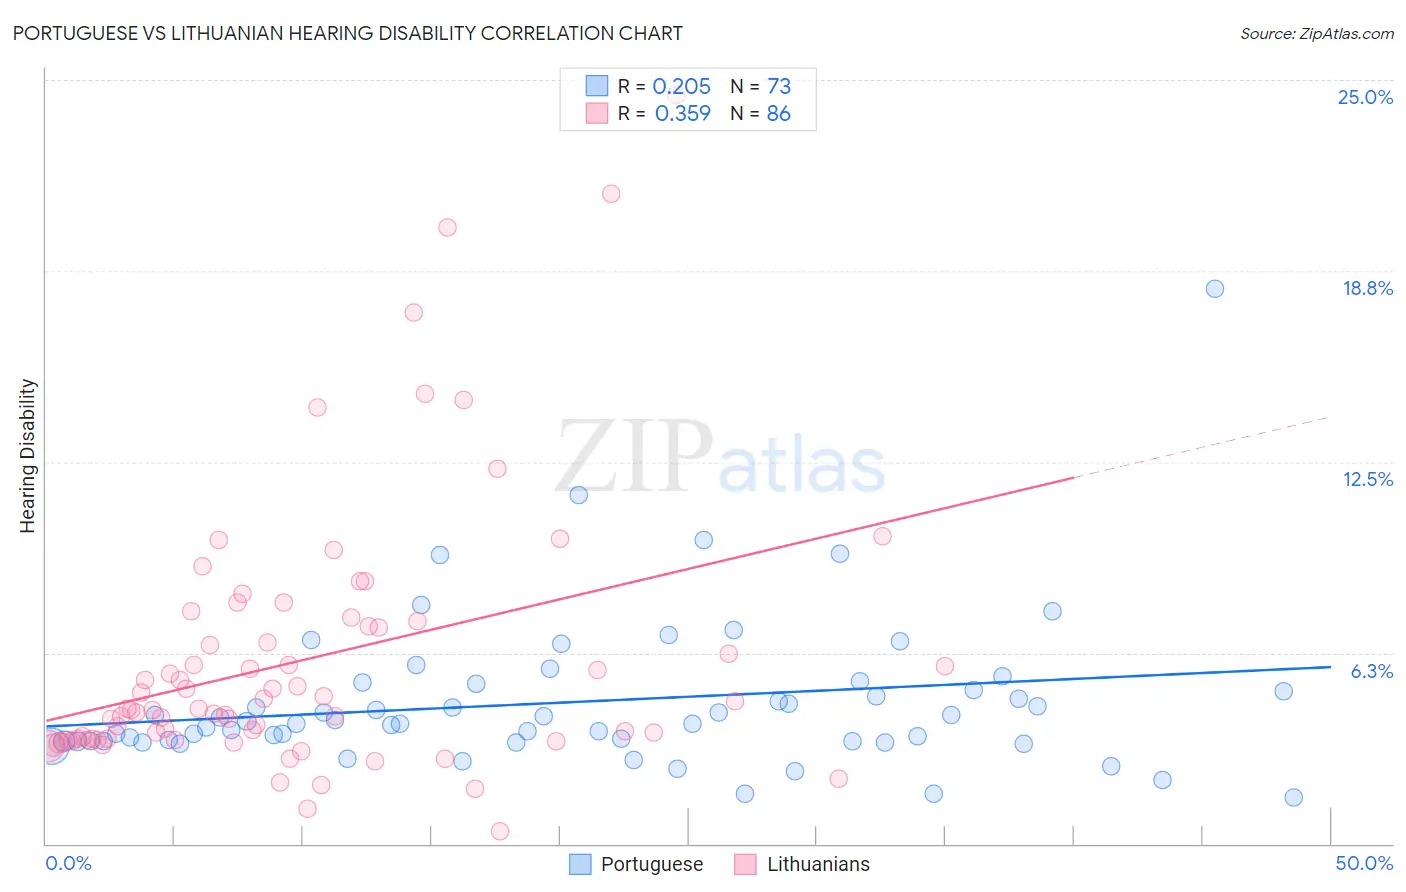
Portuguese vs Lithuanian Hearing Disability Correlation Chart
The statistical analysis conducted on geographies consisting of 450,060,128 people shows a weak positive correlation between the proportion of Portuguese and percentage of population with hearing disability in the United States with a correlation coefficient (R) of 0.205 and weighted average of 3.5%. Similarly, the statistical analysis conducted on geographies consisting of 421,806,281 people shows a mild positive correlation between the proportion of Lithuanians and percentage of population with hearing disability in the United States with a correlation coefficient (R) of 0.359 and weighted average of 3.4%, a difference of 3.2%.
Hearing Disability Correlation Summary
| Measurement | Portuguese | Lithuanian |
| Minimum | 1.5% | 0.40% |
| Maximum | 18.2% | 24.5% |
| Range | 16.7% | 24.1% |
| Mean | 4.6% | 6.0% |
| Median | 3.9% | 4.4% |
| Interquartile 25% (IQ1) | 3.4% | 3.4% |
| Interquartile 75% (IQ3) | 5.1% | 7.1% |
| Interquartile Range (IQR) | 1.8% | 3.7% |
| Standard Deviation (Sample) | 2.5% | 4.4% |
| Standard Deviation (Population) | 2.5% | 4.3% |
Demographics Similar to Portuguese and Lithuanians by Hearing Disability
In terms of hearing disability, the demographic groups most similar to Portuguese are Hawaiian (3.5%, a difference of 0.040%), Slovene (3.5%, a difference of 0.080%), Immigrants from North America (3.5%, a difference of 0.15%), Immigrants from Canada (3.5%, a difference of 0.19%), and Northern European (3.4%, a difference of 0.32%). Similarly, the demographic groups most similar to Lithuanians are Immigrants from England (3.3%, a difference of 0.20%), Austrian (3.4%, a difference of 0.22%), Immigrants from Scotland (3.3%, a difference of 0.48%), Italian (3.4%, a difference of 0.75%), and Yuman (3.4%, a difference of 0.76%).
| Demographics | Rating | Rank | Hearing Disability |
| Immigrants | Western Europe | 1.0 /100 | #243 | Tragic 3.3% |
| Assyrians/Chaldeans/Syriacs | 0.9 /100 | #244 | Tragic 3.3% |
| Immigrants | Scotland | 0.8 /100 | #245 | Tragic 3.3% |
| Immigrants | England | 0.7 /100 | #246 | Tragic 3.3% |
| Lithuanians | 0.6 /100 | #247 | Tragic 3.4% |
| Austrians | 0.6 /100 | #248 | Tragic 3.4% |
| Italians | 0.4 /100 | #249 | Tragic 3.4% |
| Yuman | 0.4 /100 | #250 | Tragic 3.4% |
| Hungarians | 0.4 /100 | #251 | Tragic 3.4% |
| Croatians | 0.4 /100 | #252 | Tragic 3.4% |
| Carpatho Rusyns | 0.3 /100 | #253 | Tragic 3.4% |
| Slavs | 0.2 /100 | #254 | Tragic 3.4% |
| Poles | 0.2 /100 | #255 | Tragic 3.4% |
| Hmong | 0.2 /100 | #256 | Tragic 3.4% |
| Yaqui | 0.2 /100 | #257 | Tragic 3.4% |
| Northern Europeans | 0.2 /100 | #258 | Tragic 3.4% |
| Slovenes | 0.1 /100 | #259 | Tragic 3.5% |
| Portuguese | 0.1 /100 | #260 | Tragic 3.5% |
| Hawaiians | 0.1 /100 | #261 | Tragic 3.5% |
| Immigrants | North America | 0.1 /100 | #262 | Tragic 3.5% |
| Immigrants | Canada | 0.1 /100 | #263 | Tragic 3.5% |