Chinese vs Immigrants from England Ambulatory Disability
COMPARE
Chinese
Immigrants from England
Ambulatory Disability
Ambulatory Disability Comparison
Chinese
Immigrants from England
6.5%
AMBULATORY DISABILITY
1.0/ 100
METRIC RATING
250th/ 347
METRIC RANK
6.1%
AMBULATORY DISABILITY
45.4/ 100
METRIC RATING
177th/ 347
METRIC RANK
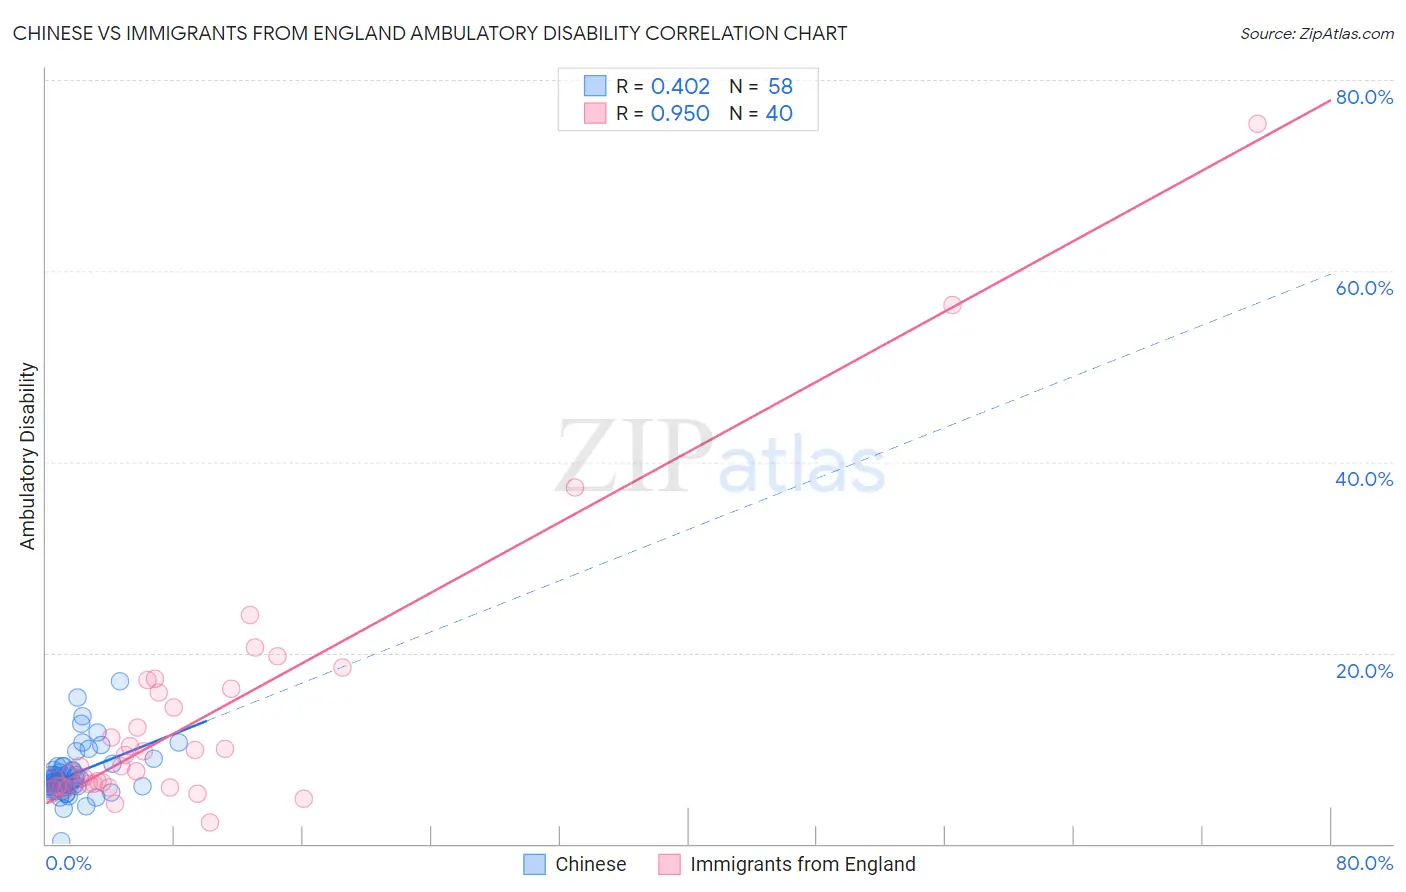
Chinese vs Immigrants from England Ambulatory Disability Correlation Chart
The statistical analysis conducted on geographies consisting of 64,795,509 people shows a moderate positive correlation between the proportion of Chinese and percentage of population with ambulatory disability in the United States with a correlation coefficient (R) of 0.402 and weighted average of 6.5%. Similarly, the statistical analysis conducted on geographies consisting of 391,842,020 people shows a perfect positive correlation between the proportion of Immigrants from England and percentage of population with ambulatory disability in the United States with a correlation coefficient (R) of 0.950 and weighted average of 6.1%, a difference of 5.8%.
Ambulatory Disability Correlation Summary
| Measurement | Chinese | Immigrants from England |
| Minimum | 0.26% | 2.3% |
| Maximum | 17.0% | 75.4% |
| Range | 16.8% | 73.1% |
| Mean | 7.3% | 13.3% |
| Median | 6.6% | 8.2% |
| Interquartile 25% (IQ1) | 5.9% | 6.1% |
| Interquartile 75% (IQ3) | 8.1% | 16.0% |
| Interquartile Range (IQR) | 2.2% | 9.9% |
| Standard Deviation (Sample) | 2.7% | 14.1% |
| Standard Deviation (Population) | 2.7% | 13.9% |
Similar Demographics by Ambulatory Disability
Demographics Similar to Chinese by Ambulatory Disability
In terms of ambulatory disability, the demographic groups most similar to Chinese are Native Hawaiian (6.5%, a difference of 0.080%), Hawaiian (6.5%, a difference of 0.18%), Immigrants from Portugal (6.5%, a difference of 0.36%), Immigrants from Cuba (6.5%, a difference of 0.38%), and Immigrants from Bahamas (6.5%, a difference of 0.38%).
| Demographics | Rating | Rank | Ambulatory Disability |
| Germans | 1.5 /100 | #243 | Tragic 6.5% |
| Immigrants | Panama | 1.5 /100 | #244 | Tragic 6.5% |
| Tlingit-Haida | 1.5 /100 | #245 | Tragic 6.5% |
| Armenians | 1.5 /100 | #246 | Tragic 6.5% |
| Immigrants | Cuba | 1.4 /100 | #247 | Tragic 6.5% |
| Immigrants | Portugal | 1.4 /100 | #248 | Tragic 6.5% |
| Native Hawaiians | 1.1 /100 | #249 | Tragic 6.5% |
| Chinese | 1.0 /100 | #250 | Tragic 6.5% |
| Hawaiians | 0.9 /100 | #251 | Tragic 6.5% |
| Immigrants | Bahamas | 0.8 /100 | #252 | Tragic 6.5% |
| Scottish | 0.7 /100 | #253 | Tragic 6.5% |
| Belizeans | 0.7 /100 | #254 | Tragic 6.5% |
| Welsh | 0.6 /100 | #255 | Tragic 6.5% |
| Immigrants | Uzbekistan | 0.6 /100 | #256 | Tragic 6.5% |
| Bermudans | 0.5 /100 | #257 | Tragic 6.5% |
Demographics Similar to Immigrants from England by Ambulatory Disability
In terms of ambulatory disability, the demographic groups most similar to Immigrants from England are Immigrants from North America (6.1%, a difference of 0.010%), Scandinavian (6.1%, a difference of 0.050%), Austrian (6.1%, a difference of 0.070%), Immigrants from Nicaragua (6.1%, a difference of 0.080%), and Vietnamese (6.1%, a difference of 0.10%).
| Demographics | Rating | Rank | Ambulatory Disability |
| Immigrants | Ecuador | 53.8 /100 | #170 | Average 6.1% |
| Moroccans | 52.6 /100 | #171 | Average 6.1% |
| Immigrants | Burma/Myanmar | 52.2 /100 | #172 | Average 6.1% |
| Croatians | 51.2 /100 | #173 | Average 6.1% |
| Immigrants | Canada | 50.0 /100 | #174 | Average 6.1% |
| Vietnamese | 47.2 /100 | #175 | Average 6.1% |
| Immigrants | North America | 45.6 /100 | #176 | Average 6.1% |
| Immigrants | England | 45.4 /100 | #177 | Average 6.1% |
| Scandinavians | 44.5 /100 | #178 | Average 6.1% |
| Austrians | 44.1 /100 | #179 | Average 6.1% |
| Immigrants | Nicaragua | 43.9 /100 | #180 | Average 6.1% |
| Swiss | 43.1 /100 | #181 | Average 6.1% |
| Serbians | 42.8 /100 | #182 | Average 6.1% |
| Immigrants | Thailand | 42.2 /100 | #183 | Average 6.1% |
| Immigrants | Ghana | 41.2 /100 | #184 | Average 6.1% |