Chinese vs Jamaican Ambulatory Disability
COMPARE
Chinese
Jamaican
Ambulatory Disability
Ambulatory Disability Comparison
Chinese
Jamaicans
6.5%
AMBULATORY DISABILITY
1.0/ 100
METRIC RATING
250th/ 347
METRIC RANK
6.7%
AMBULATORY DISABILITY
0.1/ 100
METRIC RATING
277th/ 347
METRIC RANK
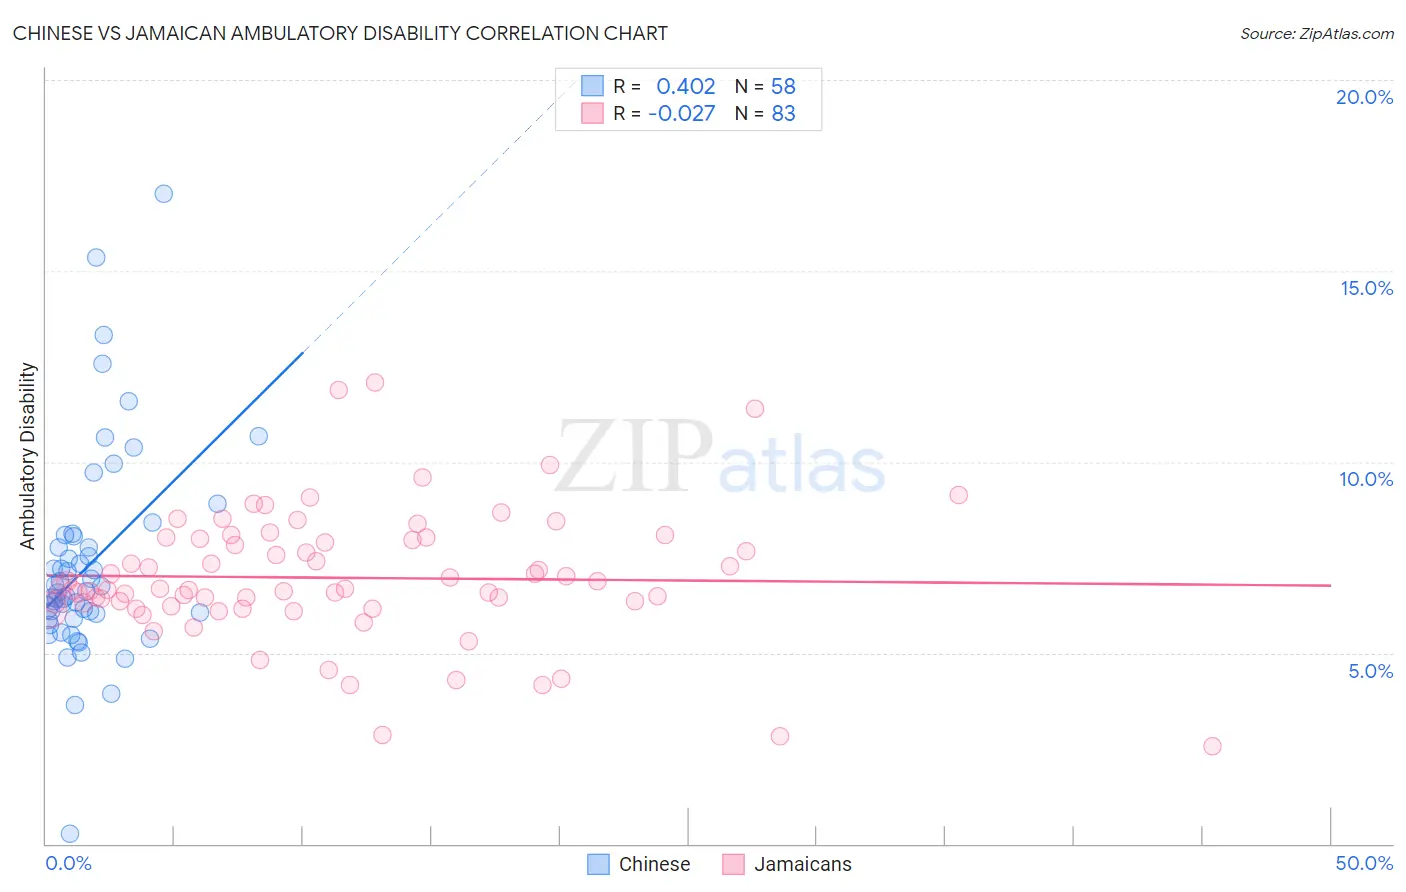
Chinese vs Jamaican Ambulatory Disability Correlation Chart
The statistical analysis conducted on geographies consisting of 64,795,509 people shows a moderate positive correlation between the proportion of Chinese and percentage of population with ambulatory disability in the United States with a correlation coefficient (R) of 0.402 and weighted average of 6.5%. Similarly, the statistical analysis conducted on geographies consisting of 367,821,612 people shows no correlation between the proportion of Jamaicans and percentage of population with ambulatory disability in the United States with a correlation coefficient (R) of -0.027 and weighted average of 6.7%, a difference of 3.6%.
Ambulatory Disability Correlation Summary
| Measurement | Chinese | Jamaican |
| Minimum | 0.26% | 2.5% |
| Maximum | 17.0% | 12.1% |
| Range | 16.8% | 9.5% |
| Mean | 7.3% | 7.0% |
| Median | 6.6% | 6.7% |
| Interquartile 25% (IQ1) | 5.9% | 6.2% |
| Interquartile 75% (IQ3) | 8.1% | 8.0% |
| Interquartile Range (IQR) | 2.2% | 1.8% |
| Standard Deviation (Sample) | 2.7% | 1.7% |
| Standard Deviation (Population) | 2.7% | 1.7% |
Similar Demographics by Ambulatory Disability
Demographics Similar to Chinese by Ambulatory Disability
In terms of ambulatory disability, the demographic groups most similar to Chinese are Native Hawaiian (6.5%, a difference of 0.080%), Hawaiian (6.5%, a difference of 0.18%), Immigrants from Portugal (6.5%, a difference of 0.36%), Immigrants from Cuba (6.5%, a difference of 0.38%), and Immigrants from Bahamas (6.5%, a difference of 0.38%).
| Demographics | Rating | Rank | Ambulatory Disability |
| Germans | 1.5 /100 | #243 | Tragic 6.5% |
| Immigrants | Panama | 1.5 /100 | #244 | Tragic 6.5% |
| Tlingit-Haida | 1.5 /100 | #245 | Tragic 6.5% |
| Armenians | 1.5 /100 | #246 | Tragic 6.5% |
| Immigrants | Cuba | 1.4 /100 | #247 | Tragic 6.5% |
| Immigrants | Portugal | 1.4 /100 | #248 | Tragic 6.5% |
| Native Hawaiians | 1.1 /100 | #249 | Tragic 6.5% |
| Chinese | 1.0 /100 | #250 | Tragic 6.5% |
| Hawaiians | 0.9 /100 | #251 | Tragic 6.5% |
| Immigrants | Bahamas | 0.8 /100 | #252 | Tragic 6.5% |
| Scottish | 0.7 /100 | #253 | Tragic 6.5% |
| Belizeans | 0.7 /100 | #254 | Tragic 6.5% |
| Welsh | 0.6 /100 | #255 | Tragic 6.5% |
| Immigrants | Uzbekistan | 0.6 /100 | #256 | Tragic 6.5% |
| Bermudans | 0.5 /100 | #257 | Tragic 6.5% |
Demographics Similar to Jamaicans by Ambulatory Disability
In terms of ambulatory disability, the demographic groups most similar to Jamaicans are Celtic (6.7%, a difference of 0.080%), Immigrants from West Indies (6.7%, a difference of 0.080%), Immigrants from Guyana (6.7%, a difference of 0.11%), Sioux (6.7%, a difference of 0.17%), and Immigrants from Caribbean (6.7%, a difference of 0.39%).
| Demographics | Rating | Rank | Ambulatory Disability |
| Slovaks | 0.1 /100 | #270 | Tragic 6.7% |
| Immigrants | Trinidad and Tobago | 0.1 /100 | #271 | Tragic 6.7% |
| French Canadians | 0.1 /100 | #272 | Tragic 6.7% |
| Whites/Caucasians | 0.1 /100 | #273 | Tragic 6.7% |
| Sioux | 0.1 /100 | #274 | Tragic 6.7% |
| Immigrants | Guyana | 0.1 /100 | #275 | Tragic 6.7% |
| Celtics | 0.1 /100 | #276 | Tragic 6.7% |
| Jamaicans | 0.1 /100 | #277 | Tragic 6.7% |
| Immigrants | West Indies | 0.1 /100 | #278 | Tragic 6.7% |
| Immigrants | Caribbean | 0.0 /100 | #279 | Tragic 6.7% |
| Pennsylvania Germans | 0.0 /100 | #280 | Tragic 6.8% |
| Yaqui | 0.0 /100 | #281 | Tragic 6.8% |
| Barbadians | 0.0 /100 | #282 | Tragic 6.8% |
| Immigrants | Barbados | 0.0 /100 | #283 | Tragic 6.8% |
| Immigrants | Jamaica | 0.0 /100 | #284 | Tragic 6.8% |