Chinese vs Immigrants from Jordan Ambulatory Disability
COMPARE
Chinese
Immigrants from Jordan
Ambulatory Disability
Ambulatory Disability Comparison
Chinese
Immigrants from Jordan
6.5%
AMBULATORY DISABILITY
1.0/ 100
METRIC RATING
250th/ 347
METRIC RANK
5.7%
AMBULATORY DISABILITY
99.2/ 100
METRIC RATING
81st/ 347
METRIC RANK
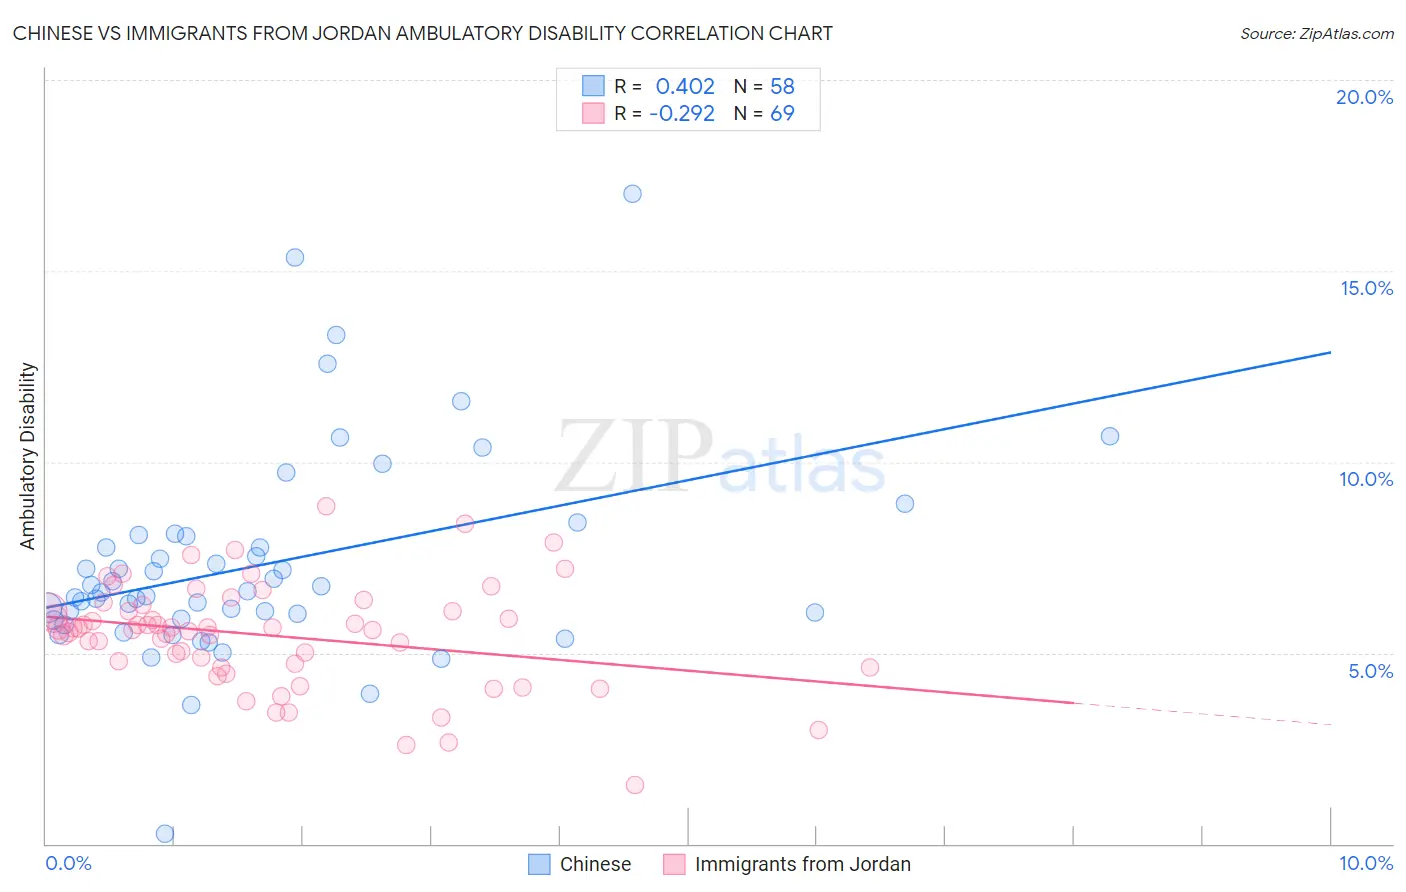
Chinese vs Immigrants from Jordan Ambulatory Disability Correlation Chart
The statistical analysis conducted on geographies consisting of 64,795,509 people shows a moderate positive correlation between the proportion of Chinese and percentage of population with ambulatory disability in the United States with a correlation coefficient (R) of 0.402 and weighted average of 6.5%. Similarly, the statistical analysis conducted on geographies consisting of 181,269,756 people shows a weak negative correlation between the proportion of Immigrants from Jordan and percentage of population with ambulatory disability in the United States with a correlation coefficient (R) of -0.292 and weighted average of 5.7%, a difference of 13.2%.
Ambulatory Disability Correlation Summary
| Measurement | Chinese | Immigrants from Jordan |
| Minimum | 0.26% | 1.5% |
| Maximum | 17.0% | 8.9% |
| Range | 16.8% | 7.3% |
| Mean | 7.3% | 5.5% |
| Median | 6.6% | 5.6% |
| Interquartile 25% (IQ1) | 5.9% | 4.7% |
| Interquartile 75% (IQ3) | 8.1% | 6.2% |
| Interquartile Range (IQR) | 2.2% | 1.5% |
| Standard Deviation (Sample) | 2.7% | 1.4% |
| Standard Deviation (Population) | 2.7% | 1.4% |
Similar Demographics by Ambulatory Disability
Demographics Similar to Chinese by Ambulatory Disability
In terms of ambulatory disability, the demographic groups most similar to Chinese are Native Hawaiian (6.5%, a difference of 0.080%), Hawaiian (6.5%, a difference of 0.18%), Immigrants from Portugal (6.5%, a difference of 0.36%), Immigrants from Cuba (6.5%, a difference of 0.38%), and Immigrants from Bahamas (6.5%, a difference of 0.38%).
| Demographics | Rating | Rank | Ambulatory Disability |
| Germans | 1.5 /100 | #243 | Tragic 6.5% |
| Immigrants | Panama | 1.5 /100 | #244 | Tragic 6.5% |
| Tlingit-Haida | 1.5 /100 | #245 | Tragic 6.5% |
| Armenians | 1.5 /100 | #246 | Tragic 6.5% |
| Immigrants | Cuba | 1.4 /100 | #247 | Tragic 6.5% |
| Immigrants | Portugal | 1.4 /100 | #248 | Tragic 6.5% |
| Native Hawaiians | 1.1 /100 | #249 | Tragic 6.5% |
| Chinese | 1.0 /100 | #250 | Tragic 6.5% |
| Hawaiians | 0.9 /100 | #251 | Tragic 6.5% |
| Immigrants | Bahamas | 0.8 /100 | #252 | Tragic 6.5% |
| Scottish | 0.7 /100 | #253 | Tragic 6.5% |
| Belizeans | 0.7 /100 | #254 | Tragic 6.5% |
| Welsh | 0.6 /100 | #255 | Tragic 6.5% |
| Immigrants | Uzbekistan | 0.6 /100 | #256 | Tragic 6.5% |
| Bermudans | 0.5 /100 | #257 | Tragic 6.5% |
Demographics Similar to Immigrants from Jordan by Ambulatory Disability
In terms of ambulatory disability, the demographic groups most similar to Immigrants from Jordan are Palestinian (5.7%, a difference of 0.0%), Immigrants from Ireland (5.7%, a difference of 0.010%), Eastern European (5.7%, a difference of 0.020%), Ugandan (5.7%, a difference of 0.030%), and Somali (5.7%, a difference of 0.14%).
| Demographics | Rating | Rank | Ambulatory Disability |
| Immigrants | Cameroon | 99.4 /100 | #74 | Exceptional 5.7% |
| Immigrants | South Africa | 99.3 /100 | #75 | Exceptional 5.7% |
| Sudanese | 99.3 /100 | #76 | Exceptional 5.7% |
| Immigrants | Vietnam | 99.3 /100 | #77 | Exceptional 5.7% |
| Somalis | 99.2 /100 | #78 | Exceptional 5.7% |
| Chileans | 99.2 /100 | #79 | Exceptional 5.7% |
| Immigrants | Ireland | 99.2 /100 | #80 | Exceptional 5.7% |
| Immigrants | Jordan | 99.2 /100 | #81 | Exceptional 5.7% |
| Palestinians | 99.2 /100 | #82 | Exceptional 5.7% |
| Eastern Europeans | 99.2 /100 | #83 | Exceptional 5.7% |
| Ugandans | 99.2 /100 | #84 | Exceptional 5.7% |
| South Americans | 99.0 /100 | #85 | Exceptional 5.7% |
| Latvians | 99.0 /100 | #86 | Exceptional 5.7% |
| Immigrants | Chile | 98.9 /100 | #87 | Exceptional 5.8% |
| Soviet Union | 98.9 /100 | #88 | Exceptional 5.8% |