Immigrants vs Immigrants from Chile Male Disability
COMPARE
Immigrants
Immigrants from Chile
Male Disability
Male Disability Comparison
Immigrants
Immigrants from Chile
10.8%
MALE DISABILITY
93.9/ 100
METRIC RATING
110th/ 347
METRIC RANK
10.6%
MALE DISABILITY
98.3/ 100
METRIC RATING
81st/ 347
METRIC RANK
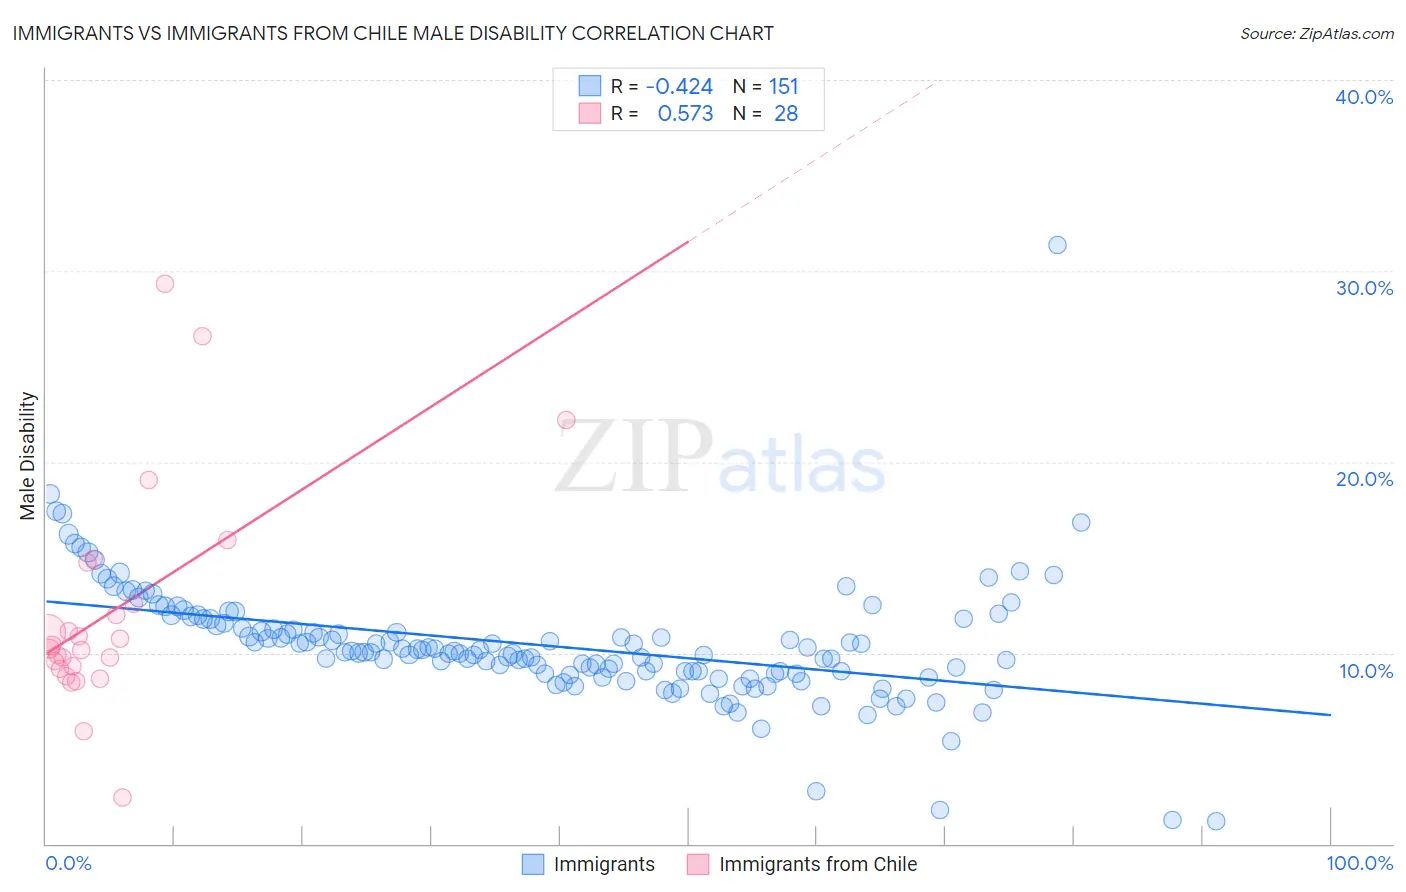
Immigrants vs Immigrants from Chile Male Disability Correlation Chart
The statistical analysis conducted on geographies consisting of 577,387,777 people shows a moderate negative correlation between the proportion of Immigrants and percentage of males with a disability in the United States with a correlation coefficient (R) of -0.424 and weighted average of 10.8%. Similarly, the statistical analysis conducted on geographies consisting of 218,637,346 people shows a substantial positive correlation between the proportion of Immigrants from Chile and percentage of males with a disability in the United States with a correlation coefficient (R) of 0.573 and weighted average of 10.6%, a difference of 1.9%.
Male Disability Correlation Summary
| Measurement | Immigrants | Immigrants from Chile |
| Minimum | 1.2% | 2.4% |
| Maximum | 31.4% | 29.3% |
| Range | 30.2% | 26.9% |
| Mean | 10.4% | 12.2% |
| Median | 10.0% | 10.3% |
| Interquartile 25% (IQ1) | 8.9% | 9.2% |
| Interquartile 75% (IQ3) | 11.8% | 13.6% |
| Interquartile Range (IQR) | 2.8% | 4.4% |
| Standard Deviation (Sample) | 3.2% | 5.8% |
| Standard Deviation (Population) | 3.2% | 5.7% |
Similar Demographics by Male Disability
Demographics Similar to Immigrants by Male Disability
In terms of male disability, the demographic groups most similar to Immigrants are Immigrants from Uganda (10.8%, a difference of 0.030%), Immigrants from Uruguay (10.8%, a difference of 0.040%), Immigrants from Belgium (10.8%, a difference of 0.080%), Immigrants from Eastern Africa (10.8%, a difference of 0.090%), and Ghanaian (10.8%, a difference of 0.14%).
| Demographics | Rating | Rank | Male Disability |
| Uruguayans | 95.3 /100 | #103 | Exceptional 10.7% |
| Immigrants | Nigeria | 95.1 /100 | #104 | Exceptional 10.8% |
| Immigrants | Brazil | 95.0 /100 | #105 | Exceptional 10.8% |
| Immigrants | Syria | 94.9 /100 | #106 | Exceptional 10.8% |
| Immigrants | Eastern Africa | 94.3 /100 | #107 | Exceptional 10.8% |
| Immigrants | Belgium | 94.2 /100 | #108 | Exceptional 10.8% |
| Immigrants | Uganda | 94.0 /100 | #109 | Exceptional 10.8% |
| Immigrants | Immigrants | 93.9 /100 | #110 | Exceptional 10.8% |
| Immigrants | Uruguay | 93.8 /100 | #111 | Exceptional 10.8% |
| Ghanaians | 93.4 /100 | #112 | Exceptional 10.8% |
| Immigrants | Zimbabwe | 93.0 /100 | #113 | Exceptional 10.8% |
| Central Americans | 92.7 /100 | #114 | Exceptional 10.8% |
| Immigrants | Barbados | 92.2 /100 | #115 | Exceptional 10.8% |
| Immigrants | South Africa | 91.8 /100 | #116 | Exceptional 10.8% |
| Eastern Europeans | 90.6 /100 | #117 | Exceptional 10.9% |
Demographics Similar to Immigrants from Chile by Male Disability
In terms of male disability, the demographic groups most similar to Immigrants from Chile are Immigrants from Jordan (10.6%, a difference of 0.060%), Immigrants from Guyana (10.6%, a difference of 0.070%), Zimbabwean (10.6%, a difference of 0.080%), Immigrants from Poland (10.6%, a difference of 0.13%), and Bulgarian (10.6%, a difference of 0.14%).
| Demographics | Rating | Rank | Male Disability |
| Immigrants | Lebanon | 98.8 /100 | #74 | Exceptional 10.5% |
| Sierra Leoneans | 98.7 /100 | #75 | Exceptional 10.5% |
| Immigrants | Sierra Leone | 98.7 /100 | #76 | Exceptional 10.5% |
| Laotians | 98.6 /100 | #77 | Exceptional 10.6% |
| Immigrants | Russia | 98.6 /100 | #78 | Exceptional 10.6% |
| Zimbabweans | 98.4 /100 | #79 | Exceptional 10.6% |
| Immigrants | Jordan | 98.4 /100 | #80 | Exceptional 10.6% |
| Immigrants | Chile | 98.3 /100 | #81 | Exceptional 10.6% |
| Immigrants | Guyana | 98.2 /100 | #82 | Exceptional 10.6% |
| Immigrants | Poland | 98.1 /100 | #83 | Exceptional 10.6% |
| Bulgarians | 98.1 /100 | #84 | Exceptional 10.6% |
| Sri Lankans | 97.9 /100 | #85 | Exceptional 10.6% |
| Immigrants | Ireland | 97.9 /100 | #86 | Exceptional 10.6% |
| Immigrants | Vietnam | 97.9 /100 | #87 | Exceptional 10.6% |
| Immigrants | Western Asia | 97.8 /100 | #88 | Exceptional 10.6% |