Pima vs Immigrants from Cameroon Self-Care Disability
COMPARE
Pima
Immigrants from Cameroon
Self-Care Disability
Self-Care Disability Comparison
Pima
Immigrants from Cameroon
2.8%
SELF-CARE DISABILITY
0.0/ 100
METRIC RATING
301st/ 347
METRIC RANK
2.3%
SELF-CARE DISABILITY
99.6/ 100
METRIC RATING
58th/ 347
METRIC RANK
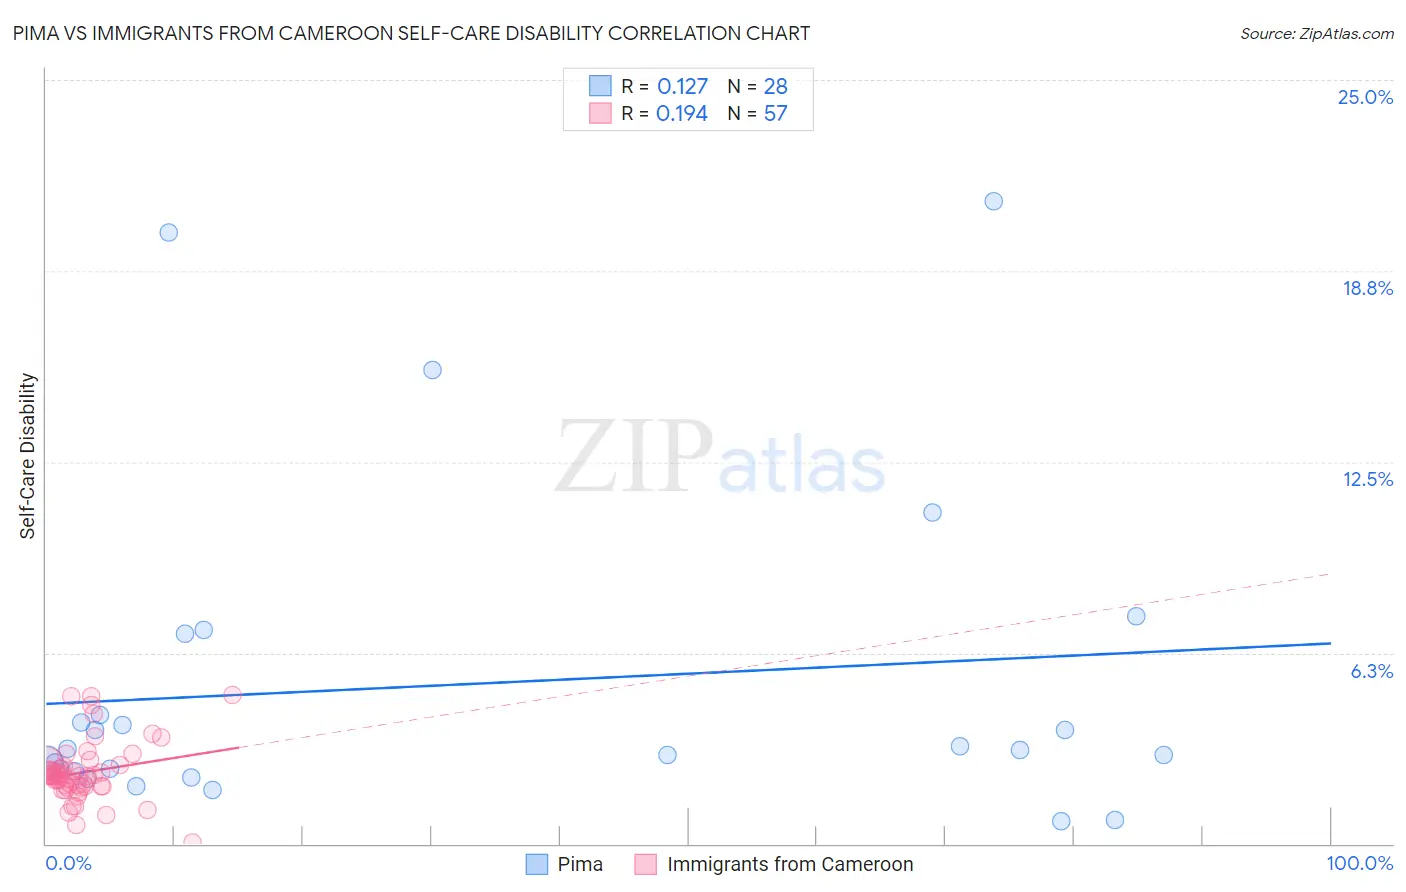
Pima vs Immigrants from Cameroon Self-Care Disability Correlation Chart
The statistical analysis conducted on geographies consisting of 61,528,546 people shows a poor positive correlation between the proportion of Pima and percentage of population with self-care disability in the United States with a correlation coefficient (R) of 0.127 and weighted average of 2.8%. Similarly, the statistical analysis conducted on geographies consisting of 130,698,319 people shows a poor positive correlation between the proportion of Immigrants from Cameroon and percentage of population with self-care disability in the United States with a correlation coefficient (R) of 0.194 and weighted average of 2.3%, a difference of 20.6%.
Self-Care Disability Correlation Summary
| Measurement | Pima | Immigrants from Cameroon |
| Minimum | 0.75% | 0.061% |
| Maximum | 21.0% | 4.9% |
| Range | 20.3% | 4.8% |
| Mean | 5.2% | 2.3% |
| Median | 3.1% | 2.2% |
| Interquartile 25% (IQ1) | 2.4% | 1.9% |
| Interquartile 75% (IQ3) | 5.5% | 2.6% |
| Interquartile Range (IQR) | 3.1% | 0.67% |
| Standard Deviation (Sample) | 5.3% | 0.97% |
| Standard Deviation (Population) | 5.2% | 0.96% |
Similar Demographics by Self-Care Disability
Demographics Similar to Pima by Self-Care Disability
In terms of self-care disability, the demographic groups most similar to Pima are Immigrants from St. Vincent and the Grenadines (2.8%, a difference of 0.040%), Immigrants from Fiji (2.8%, a difference of 0.090%), Immigrants from Belize (2.8%, a difference of 0.18%), Cree (2.8%, a difference of 0.34%), and Immigrants from West Indies (2.8%, a difference of 0.39%).
| Demographics | Rating | Rank | Self-Care Disability |
| Blackfeet | 0.0 /100 | #294 | Tragic 2.7% |
| Barbadians | 0.0 /100 | #295 | Tragic 2.7% |
| Immigrants | Portugal | 0.0 /100 | #296 | Tragic 2.8% |
| West Indians | 0.0 /100 | #297 | Tragic 2.8% |
| Americans | 0.0 /100 | #298 | Tragic 2.8% |
| Immigrants | Guyana | 0.0 /100 | #299 | Tragic 2.8% |
| Immigrants | Fiji | 0.0 /100 | #300 | Tragic 2.8% |
| Pima | 0.0 /100 | #301 | Tragic 2.8% |
| Immigrants | St. Vincent and the Grenadines | 0.0 /100 | #302 | Tragic 2.8% |
| Immigrants | Belize | 0.0 /100 | #303 | Tragic 2.8% |
| Cree | 0.0 /100 | #304 | Tragic 2.8% |
| Immigrants | West Indies | 0.0 /100 | #305 | Tragic 2.8% |
| Aleuts | 0.0 /100 | #306 | Tragic 2.8% |
| Natives/Alaskans | 0.0 /100 | #307 | Tragic 2.8% |
| Immigrants | Grenada | 0.0 /100 | #308 | Tragic 2.8% |
Demographics Similar to Immigrants from Cameroon by Self-Care Disability
In terms of self-care disability, the demographic groups most similar to Immigrants from Cameroon are Immigrants from Belgium (2.3%, a difference of 0.070%), Immigrants from Eastern Asia (2.3%, a difference of 0.080%), New Zealander (2.3%, a difference of 0.11%), Immigrants from France (2.3%, a difference of 0.12%), and Argentinean (2.3%, a difference of 0.18%).
| Demographics | Rating | Rank | Self-Care Disability |
| Kenyans | 99.7 /100 | #51 | Exceptional 2.3% |
| Immigrants | Serbia | 99.6 /100 | #52 | Exceptional 2.3% |
| Australians | 99.6 /100 | #53 | Exceptional 2.3% |
| Argentineans | 99.6 /100 | #54 | Exceptional 2.3% |
| Immigrants | France | 99.6 /100 | #55 | Exceptional 2.3% |
| Immigrants | Eastern Asia | 99.6 /100 | #56 | Exceptional 2.3% |
| Immigrants | Belgium | 99.6 /100 | #57 | Exceptional 2.3% |
| Immigrants | Cameroon | 99.6 /100 | #58 | Exceptional 2.3% |
| New Zealanders | 99.5 /100 | #59 | Exceptional 2.3% |
| Immigrants | Japan | 99.5 /100 | #60 | Exceptional 2.3% |
| Palestinians | 99.4 /100 | #61 | Exceptional 2.3% |
| Egyptians | 99.4 /100 | #62 | Exceptional 2.3% |
| Mongolians | 99.3 /100 | #63 | Exceptional 2.3% |
| Swedes | 99.3 /100 | #64 | Exceptional 2.3% |
| Brazilians | 99.3 /100 | #65 | Exceptional 2.3% |