Immigrants from Netherlands vs Immigrants from Cameroon Self-Care Disability
COMPARE
Immigrants from Netherlands
Immigrants from Cameroon
Self-Care Disability
Self-Care Disability Comparison
Immigrants from Netherlands
Immigrants from Cameroon
2.3%
SELF-CARE DISABILITY
99.1/ 100
METRIC RATING
75th/ 347
METRIC RANK
2.3%
SELF-CARE DISABILITY
99.6/ 100
METRIC RATING
58th/ 347
METRIC RANK
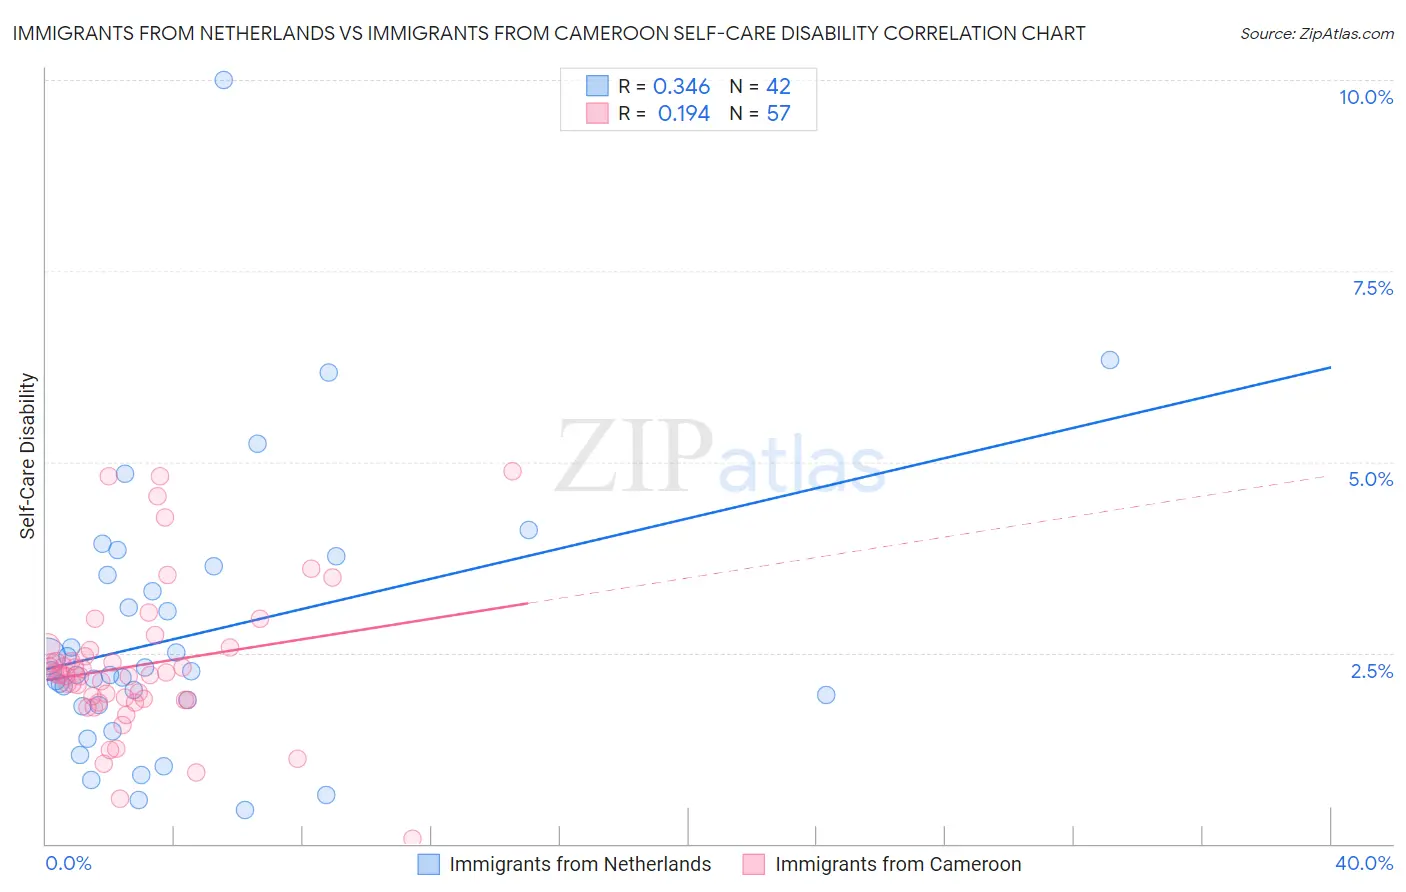
Immigrants from Netherlands vs Immigrants from Cameroon Self-Care Disability Correlation Chart
The statistical analysis conducted on geographies consisting of 237,728,071 people shows a mild positive correlation between the proportion of Immigrants from Netherlands and percentage of population with self-care disability in the United States with a correlation coefficient (R) of 0.346 and weighted average of 2.3%. Similarly, the statistical analysis conducted on geographies consisting of 130,698,319 people shows a poor positive correlation between the proportion of Immigrants from Cameroon and percentage of population with self-care disability in the United States with a correlation coefficient (R) of 0.194 and weighted average of 2.3%, a difference of 0.98%.
Self-Care Disability Correlation Summary
| Measurement | Immigrants from Netherlands | Immigrants from Cameroon |
| Minimum | 0.45% | 0.061% |
| Maximum | 10.0% | 4.9% |
| Range | 9.5% | 4.8% |
| Mean | 2.7% | 2.3% |
| Median | 2.2% | 2.2% |
| Interquartile 25% (IQ1) | 1.8% | 1.9% |
| Interquartile 75% (IQ3) | 3.5% | 2.6% |
| Interquartile Range (IQR) | 1.7% | 0.67% |
| Standard Deviation (Sample) | 1.8% | 0.97% |
| Standard Deviation (Population) | 1.8% | 0.96% |
Demographics Similar to Immigrants from Netherlands and Immigrants from Cameroon by Self-Care Disability
In terms of self-care disability, the demographic groups most similar to Immigrants from Netherlands are Immigrants from China (2.3%, a difference of 0.010%), Immigrants from Switzerland (2.3%, a difference of 0.040%), Immigrants from Egypt (2.3%, a difference of 0.10%), Eastern European (2.3%, a difference of 0.13%), and Asian (2.3%, a difference of 0.16%). Similarly, the demographic groups most similar to Immigrants from Cameroon are Immigrants from Belgium (2.3%, a difference of 0.070%), Immigrants from Eastern Asia (2.3%, a difference of 0.080%), New Zealander (2.3%, a difference of 0.11%), Immigrants from Japan (2.3%, a difference of 0.25%), and Palestinian (2.3%, a difference of 0.35%).
| Demographics | Rating | Rank | Self-Care Disability |
| Immigrants | Eastern Asia | 99.6 /100 | #56 | Exceptional 2.3% |
| Immigrants | Belgium | 99.6 /100 | #57 | Exceptional 2.3% |
| Immigrants | Cameroon | 99.6 /100 | #58 | Exceptional 2.3% |
| New Zealanders | 99.5 /100 | #59 | Exceptional 2.3% |
| Immigrants | Japan | 99.5 /100 | #60 | Exceptional 2.3% |
| Palestinians | 99.4 /100 | #61 | Exceptional 2.3% |
| Egyptians | 99.4 /100 | #62 | Exceptional 2.3% |
| Mongolians | 99.3 /100 | #63 | Exceptional 2.3% |
| Swedes | 99.3 /100 | #64 | Exceptional 2.3% |
| Brazilians | 99.3 /100 | #65 | Exceptional 2.3% |
| Immigrants | Argentina | 99.3 /100 | #66 | Exceptional 2.3% |
| South Africans | 99.3 /100 | #67 | Exceptional 2.3% |
| Immigrants | Zaire | 99.2 /100 | #68 | Exceptional 2.3% |
| Immigrants | Norway | 99.2 /100 | #69 | Exceptional 2.3% |
| Immigrants | Northern Europe | 99.2 /100 | #70 | Exceptional 2.3% |
| Asians | 99.2 /100 | #71 | Exceptional 2.3% |
| Eastern Europeans | 99.2 /100 | #72 | Exceptional 2.3% |
| Immigrants | Egypt | 99.1 /100 | #73 | Exceptional 2.3% |
| Immigrants | Switzerland | 99.1 /100 | #74 | Exceptional 2.3% |
| Immigrants | Netherlands | 99.1 /100 | #75 | Exceptional 2.3% |
| Immigrants | China | 99.1 /100 | #76 | Exceptional 2.3% |