Central American vs Immigrants from the Azores Master's Degree
COMPARE
Central American
Immigrants from the Azores
Master's Degree
Master's Degree Comparison
Central Americans
Immigrants from the Azores
12.2%
MASTER'S DEGREE
0.3/ 100
METRIC RATING
269th/ 347
METRIC RANK
10.2%
MASTER'S DEGREE
0.0/ 100
METRIC RATING
332nd/ 347
METRIC RANK
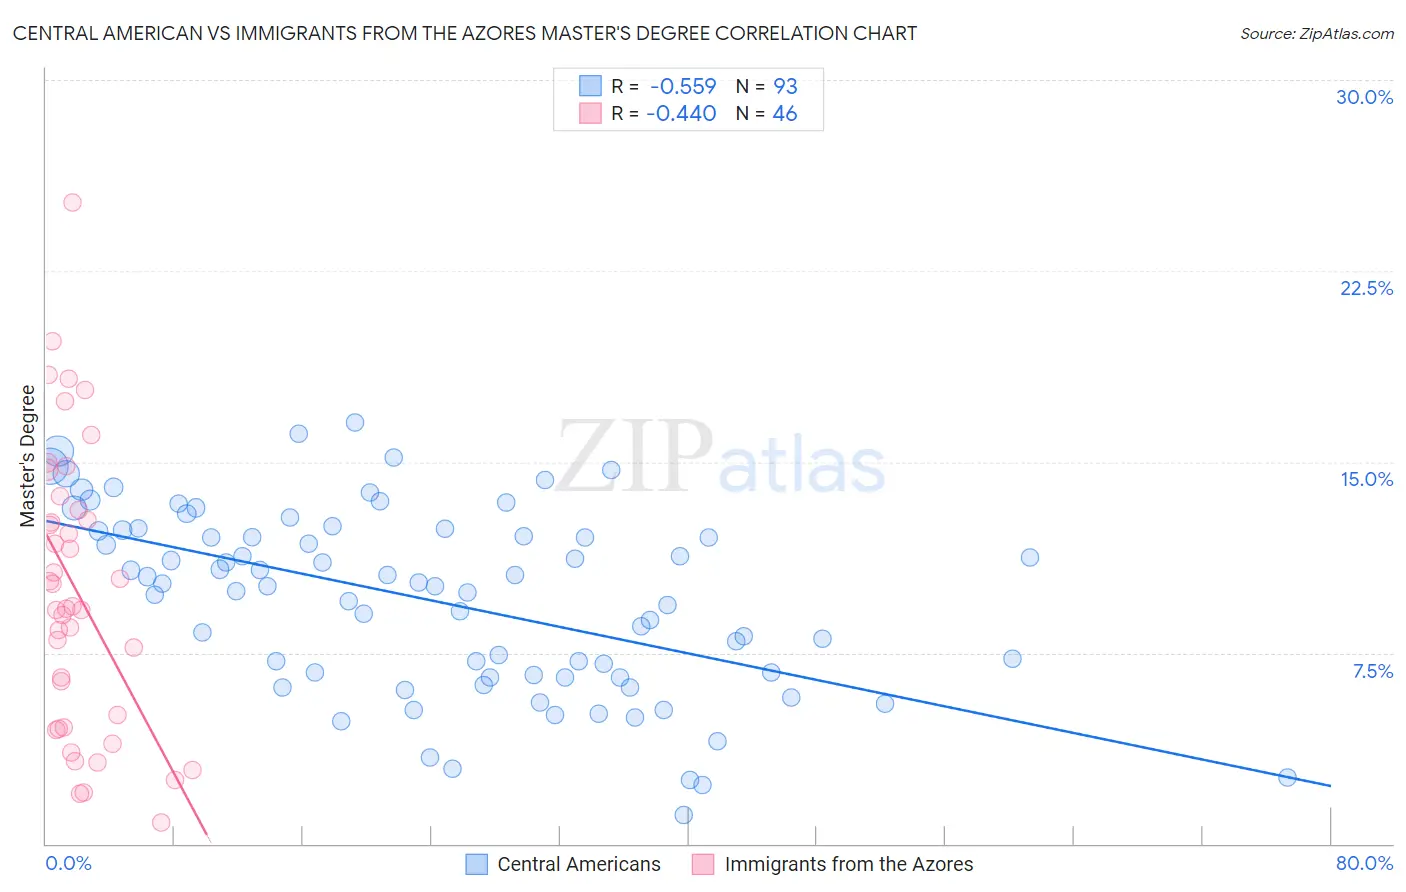
Central American vs Immigrants from the Azores Master's Degree Correlation Chart
The statistical analysis conducted on geographies consisting of 504,206,003 people shows a substantial negative correlation between the proportion of Central Americans and percentage of population with at least master's degree education in the United States with a correlation coefficient (R) of -0.559 and weighted average of 12.2%. Similarly, the statistical analysis conducted on geographies consisting of 46,256,023 people shows a moderate negative correlation between the proportion of Immigrants from the Azores and percentage of population with at least master's degree education in the United States with a correlation coefficient (R) of -0.440 and weighted average of 10.2%, a difference of 19.2%.
Master's Degree Correlation Summary
| Measurement | Central American | Immigrants from the Azores |
| Minimum | 1.1% | 0.81% |
| Maximum | 16.6% | 25.2% |
| Range | 15.4% | 24.4% |
| Mean | 9.5% | 9.9% |
| Median | 10.1% | 9.3% |
| Interquartile 25% (IQ1) | 6.6% | 4.6% |
| Interquartile 75% (IQ3) | 12.3% | 13.1% |
| Interquartile Range (IQR) | 5.7% | 8.5% |
| Standard Deviation (Sample) | 3.6% | 5.6% |
| Standard Deviation (Population) | 3.6% | 5.5% |
Similar Demographics by Master's Degree
Demographics Similar to Central Americans by Master's Degree
In terms of master's degree, the demographic groups most similar to Central Americans are Salvadoran (12.2%, a difference of 0.13%), Native Hawaiian (12.3%, a difference of 0.65%), Haitian (12.1%, a difference of 0.72%), Comanche (12.1%, a difference of 0.78%), and Blackfeet (12.1%, a difference of 0.87%).
| Demographics | Rating | Rank | Master's Degree |
| Nicaraguans | 0.6 /100 | #262 | Tragic 12.5% |
| Central American Indians | 0.5 /100 | #263 | Tragic 12.4% |
| Belizeans | 0.5 /100 | #264 | Tragic 12.4% |
| Immigrants | Fiji | 0.5 /100 | #265 | Tragic 12.4% |
| Bahamians | 0.5 /100 | #266 | Tragic 12.4% |
| Americans | 0.4 /100 | #267 | Tragic 12.3% |
| Native Hawaiians | 0.4 /100 | #268 | Tragic 12.3% |
| Central Americans | 0.3 /100 | #269 | Tragic 12.2% |
| Salvadorans | 0.3 /100 | #270 | Tragic 12.2% |
| Haitians | 0.3 /100 | #271 | Tragic 12.1% |
| Comanche | 0.3 /100 | #272 | Tragic 12.1% |
| Blackfeet | 0.3 /100 | #273 | Tragic 12.1% |
| Cape Verdeans | 0.3 /100 | #274 | Tragic 12.1% |
| Cubans | 0.3 /100 | #275 | Tragic 12.1% |
| Blacks/African Americans | 0.3 /100 | #276 | Tragic 12.1% |
Demographics Similar to Immigrants from the Azores by Master's Degree
In terms of master's degree, the demographic groups most similar to Immigrants from the Azores are Menominee (10.2%, a difference of 0.37%), Pueblo (10.3%, a difference of 0.46%), Fijian (10.3%, a difference of 0.63%), Arapaho (10.0%, a difference of 2.3%), and Nepalese (10.5%, a difference of 2.4%).
| Demographics | Rating | Rank | Master's Degree |
| Inupiat | 0.0 /100 | #325 | Tragic 10.5% |
| Creek | 0.0 /100 | #326 | Tragic 10.5% |
| Paiute | 0.0 /100 | #327 | Tragic 10.5% |
| Bangladeshis | 0.0 /100 | #328 | Tragic 10.5% |
| Nepalese | 0.0 /100 | #329 | Tragic 10.5% |
| Fijians | 0.0 /100 | #330 | Tragic 10.3% |
| Pueblo | 0.0 /100 | #331 | Tragic 10.3% |
| Immigrants | Azores | 0.0 /100 | #332 | Tragic 10.2% |
| Menominee | 0.0 /100 | #333 | Tragic 10.2% |
| Arapaho | 0.0 /100 | #334 | Tragic 10.0% |
| Immigrants | Central America | 0.0 /100 | #335 | Tragic 10.0% |
| Natives/Alaskans | 0.0 /100 | #336 | Tragic 9.9% |
| Mexicans | 0.0 /100 | #337 | Tragic 9.7% |
| Tohono O'odham | 0.0 /100 | #338 | Tragic 9.7% |
| Spanish American Indians | 0.0 /100 | #339 | Tragic 9.6% |