Central American vs Nonimmigrants Vision Disability
COMPARE
Central American
Nonimmigrants
Vision Disability
Vision Disability Comparison
Central Americans
Nonimmigrants
2.3%
VISION DISABILITY
1.8/ 100
METRIC RATING
233rd/ 347
METRIC RANK
2.5%
VISION DISABILITY
0.0/ 100
METRIC RATING
289th/ 347
METRIC RANK
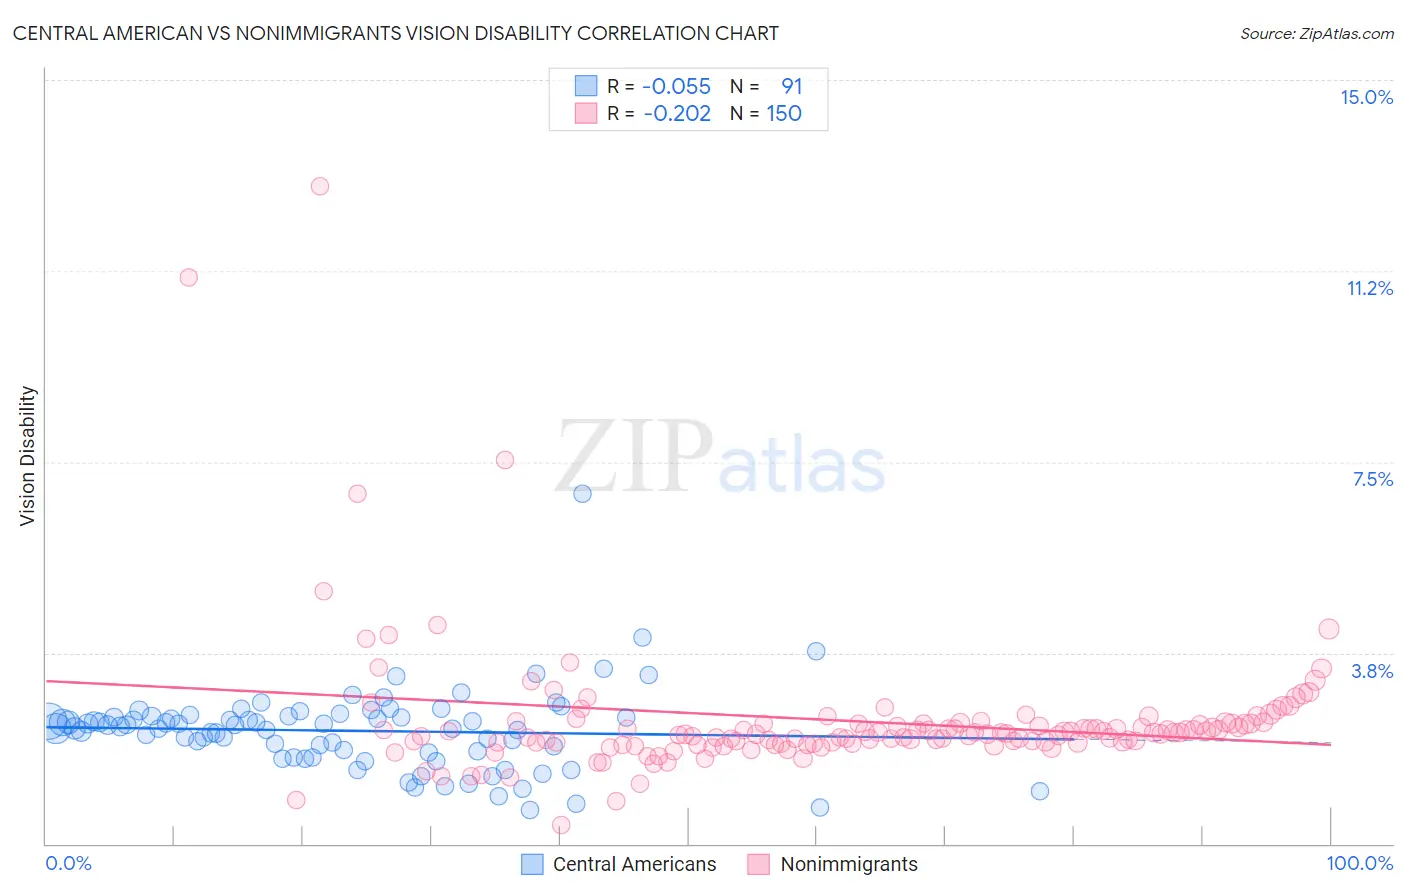
Central American vs Nonimmigrants Vision Disability Correlation Chart
The statistical analysis conducted on geographies consisting of 503,926,566 people shows a slight negative correlation between the proportion of Central Americans and percentage of population with vision disability in the United States with a correlation coefficient (R) of -0.055 and weighted average of 2.3%. Similarly, the statistical analysis conducted on geographies consisting of 581,859,538 people shows a weak negative correlation between the proportion of Nonimmigrants and percentage of population with vision disability in the United States with a correlation coefficient (R) of -0.202 and weighted average of 2.5%, a difference of 7.6%.
Vision Disability Correlation Summary
| Measurement | Central American | Nonimmigrants |
| Minimum | 0.66% | 0.37% |
| Maximum | 6.9% | 12.9% |
| Range | 6.2% | 12.5% |
| Mean | 2.2% | 2.4% |
| Median | 2.3% | 2.2% |
| Interquartile 25% (IQ1) | 1.8% | 2.0% |
| Interquartile 75% (IQ3) | 2.5% | 2.4% |
| Interquartile Range (IQR) | 0.71% | 0.38% |
| Standard Deviation (Sample) | 0.81% | 1.4% |
| Standard Deviation (Population) | 0.81% | 1.4% |
Similar Demographics by Vision Disability
Demographics Similar to Central Americans by Vision Disability
In terms of vision disability, the demographic groups most similar to Central Americans are German Russian (2.3%, a difference of 0.020%), Scottish (2.3%, a difference of 0.18%), Immigrants from Ecuador (2.3%, a difference of 0.20%), Marshallese (2.3%, a difference of 0.25%), and Immigrants from Congo (2.3%, a difference of 0.34%).
| Demographics | Rating | Rank | Vision Disability |
| Immigrants | Germany | 3.0 /100 | #226 | Tragic 2.3% |
| Hawaiians | 2.9 /100 | #227 | Tragic 2.3% |
| Hmong | 2.5 /100 | #228 | Tragic 2.3% |
| Welsh | 2.3 /100 | #229 | Tragic 2.3% |
| Nicaraguans | 2.2 /100 | #230 | Tragic 2.3% |
| Immigrants | Ecuador | 2.0 /100 | #231 | Tragic 2.3% |
| German Russians | 1.8 /100 | #232 | Tragic 2.3% |
| Central Americans | 1.8 /100 | #233 | Tragic 2.3% |
| Scottish | 1.6 /100 | #234 | Tragic 2.3% |
| Marshallese | 1.5 /100 | #235 | Tragic 2.3% |
| Immigrants | Congo | 1.4 /100 | #236 | Tragic 2.3% |
| Immigrants | Portugal | 1.4 /100 | #237 | Tragic 2.3% |
| Immigrants | Cambodia | 1.1 /100 | #238 | Tragic 2.3% |
| English | 1.1 /100 | #239 | Tragic 2.3% |
| Panamanians | 0.9 /100 | #240 | Tragic 2.3% |
Demographics Similar to Nonimmigrants by Vision Disability
In terms of vision disability, the demographic groups most similar to Nonimmigrants are Immigrants from Cuba (2.5%, a difference of 0.14%), French American Indian (2.5%, a difference of 0.41%), Honduran (2.5%, a difference of 0.43%), Immigrants from Honduras (2.5%, a difference of 0.53%), and Sioux (2.5%, a difference of 0.57%).
| Demographics | Rating | Rank | Vision Disability |
| Immigrants | Caribbean | 0.0 /100 | #282 | Tragic 2.5% |
| Puget Sound Salish | 0.0 /100 | #283 | Tragic 2.5% |
| Yakama | 0.0 /100 | #284 | Tragic 2.5% |
| Immigrants | Central America | 0.0 /100 | #285 | Tragic 2.5% |
| Sioux | 0.0 /100 | #286 | Tragic 2.5% |
| Hondurans | 0.0 /100 | #287 | Tragic 2.5% |
| French American Indians | 0.0 /100 | #288 | Tragic 2.5% |
| Immigrants | Nonimmigrants | 0.0 /100 | #289 | Tragic 2.5% |
| Immigrants | Cuba | 0.0 /100 | #290 | Tragic 2.5% |
| Immigrants | Honduras | 0.0 /100 | #291 | Tragic 2.5% |
| Crow | 0.0 /100 | #292 | Tragic 2.5% |
| Yaqui | 0.0 /100 | #293 | Tragic 2.5% |
| Ottawa | 0.0 /100 | #294 | Tragic 2.5% |
| Delaware | 0.0 /100 | #295 | Tragic 2.5% |
| Immigrants | Mexico | 0.0 /100 | #296 | Tragic 2.5% |