Central American vs Mongolian Vision Disability
COMPARE
Central American
Mongolian
Vision Disability
Vision Disability Comparison
Central Americans
Mongolians
2.3%
VISION DISABILITY
1.8/ 100
METRIC RATING
233rd/ 347
METRIC RANK
1.9%
VISION DISABILITY
99.9/ 100
METRIC RATING
31st/ 347
METRIC RANK
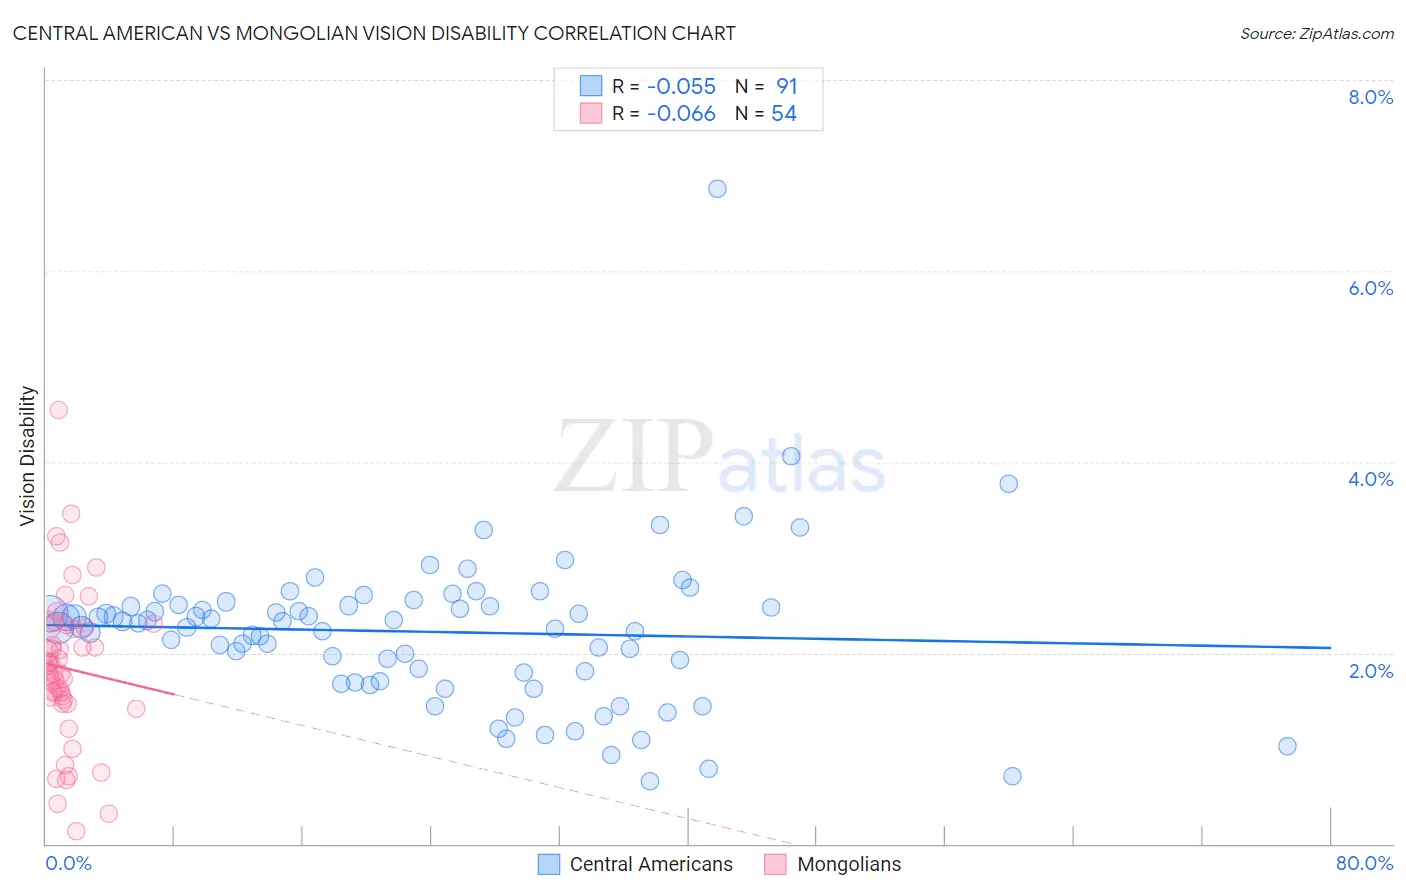
Central American vs Mongolian Vision Disability Correlation Chart
The statistical analysis conducted on geographies consisting of 503,926,566 people shows a slight negative correlation between the proportion of Central Americans and percentage of population with vision disability in the United States with a correlation coefficient (R) of -0.055 and weighted average of 2.3%. Similarly, the statistical analysis conducted on geographies consisting of 140,326,151 people shows a slight negative correlation between the proportion of Mongolians and percentage of population with vision disability in the United States with a correlation coefficient (R) of -0.066 and weighted average of 1.9%, a difference of 19.2%.
Vision Disability Correlation Summary
| Measurement | Central American | Mongolian |
| Minimum | 0.66% | 0.13% |
| Maximum | 6.9% | 4.5% |
| Range | 6.2% | 4.4% |
| Mean | 2.2% | 1.8% |
| Median | 2.3% | 1.8% |
| Interquartile 25% (IQ1) | 1.8% | 1.5% |
| Interquartile 75% (IQ3) | 2.5% | 2.3% |
| Interquartile Range (IQR) | 0.71% | 0.76% |
| Standard Deviation (Sample) | 0.81% | 0.81% |
| Standard Deviation (Population) | 0.81% | 0.80% |
Similar Demographics by Vision Disability
Demographics Similar to Central Americans by Vision Disability
In terms of vision disability, the demographic groups most similar to Central Americans are German Russian (2.3%, a difference of 0.020%), Scottish (2.3%, a difference of 0.18%), Immigrants from Ecuador (2.3%, a difference of 0.20%), Marshallese (2.3%, a difference of 0.25%), and Immigrants from Congo (2.3%, a difference of 0.34%).
| Demographics | Rating | Rank | Vision Disability |
| Immigrants | Germany | 3.0 /100 | #226 | Tragic 2.3% |
| Hawaiians | 2.9 /100 | #227 | Tragic 2.3% |
| Hmong | 2.5 /100 | #228 | Tragic 2.3% |
| Welsh | 2.3 /100 | #229 | Tragic 2.3% |
| Nicaraguans | 2.2 /100 | #230 | Tragic 2.3% |
| Immigrants | Ecuador | 2.0 /100 | #231 | Tragic 2.3% |
| German Russians | 1.8 /100 | #232 | Tragic 2.3% |
| Central Americans | 1.8 /100 | #233 | Tragic 2.3% |
| Scottish | 1.6 /100 | #234 | Tragic 2.3% |
| Marshallese | 1.5 /100 | #235 | Tragic 2.3% |
| Immigrants | Congo | 1.4 /100 | #236 | Tragic 2.3% |
| Immigrants | Portugal | 1.4 /100 | #237 | Tragic 2.3% |
| Immigrants | Cambodia | 1.1 /100 | #238 | Tragic 2.3% |
| English | 1.1 /100 | #239 | Tragic 2.3% |
| Panamanians | 0.9 /100 | #240 | Tragic 2.3% |
Demographics Similar to Mongolians by Vision Disability
In terms of vision disability, the demographic groups most similar to Mongolians are Immigrants from Nepal (1.9%, a difference of 0.17%), Egyptian (1.9%, a difference of 0.20%), Immigrants from Malaysia (1.9%, a difference of 0.27%), Luxembourger (1.9%, a difference of 0.27%), and Taiwanese (1.9%, a difference of 0.29%).
| Demographics | Rating | Rank | Vision Disability |
| Immigrants | Lithuania | 99.9 /100 | #24 | Exceptional 1.9% |
| Bulgarians | 99.9 /100 | #25 | Exceptional 1.9% |
| Immigrants | Japan | 99.9 /100 | #26 | Exceptional 1.9% |
| Taiwanese | 99.9 /100 | #27 | Exceptional 1.9% |
| Immigrants | Malaysia | 99.9 /100 | #28 | Exceptional 1.9% |
| Egyptians | 99.9 /100 | #29 | Exceptional 1.9% |
| Immigrants | Nepal | 99.9 /100 | #30 | Exceptional 1.9% |
| Mongolians | 99.9 /100 | #31 | Exceptional 1.9% |
| Luxembourgers | 99.9 /100 | #32 | Exceptional 1.9% |
| Immigrants | Egypt | 99.9 /100 | #33 | Exceptional 1.9% |
| Immigrants | Turkey | 99.8 /100 | #34 | Exceptional 1.9% |
| Immigrants | Australia | 99.8 /100 | #35 | Exceptional 1.9% |
| Cambodians | 99.8 /100 | #36 | Exceptional 2.0% |
| Bhutanese | 99.8 /100 | #37 | Exceptional 2.0% |
| Immigrants | Kuwait | 99.8 /100 | #38 | Exceptional 2.0% |