Central American vs Immigrants from the Azores 4th Grade
COMPARE
Central American
Immigrants from the Azores
4th Grade
4th Grade Comparison
Central Americans
Immigrants from the Azores
95.5%
4TH GRADE
0.0/ 100
METRIC RATING
337th/ 347
METRIC RANK
96.1%
4TH GRADE
0.0/ 100
METRIC RATING
318th/ 347
METRIC RANK
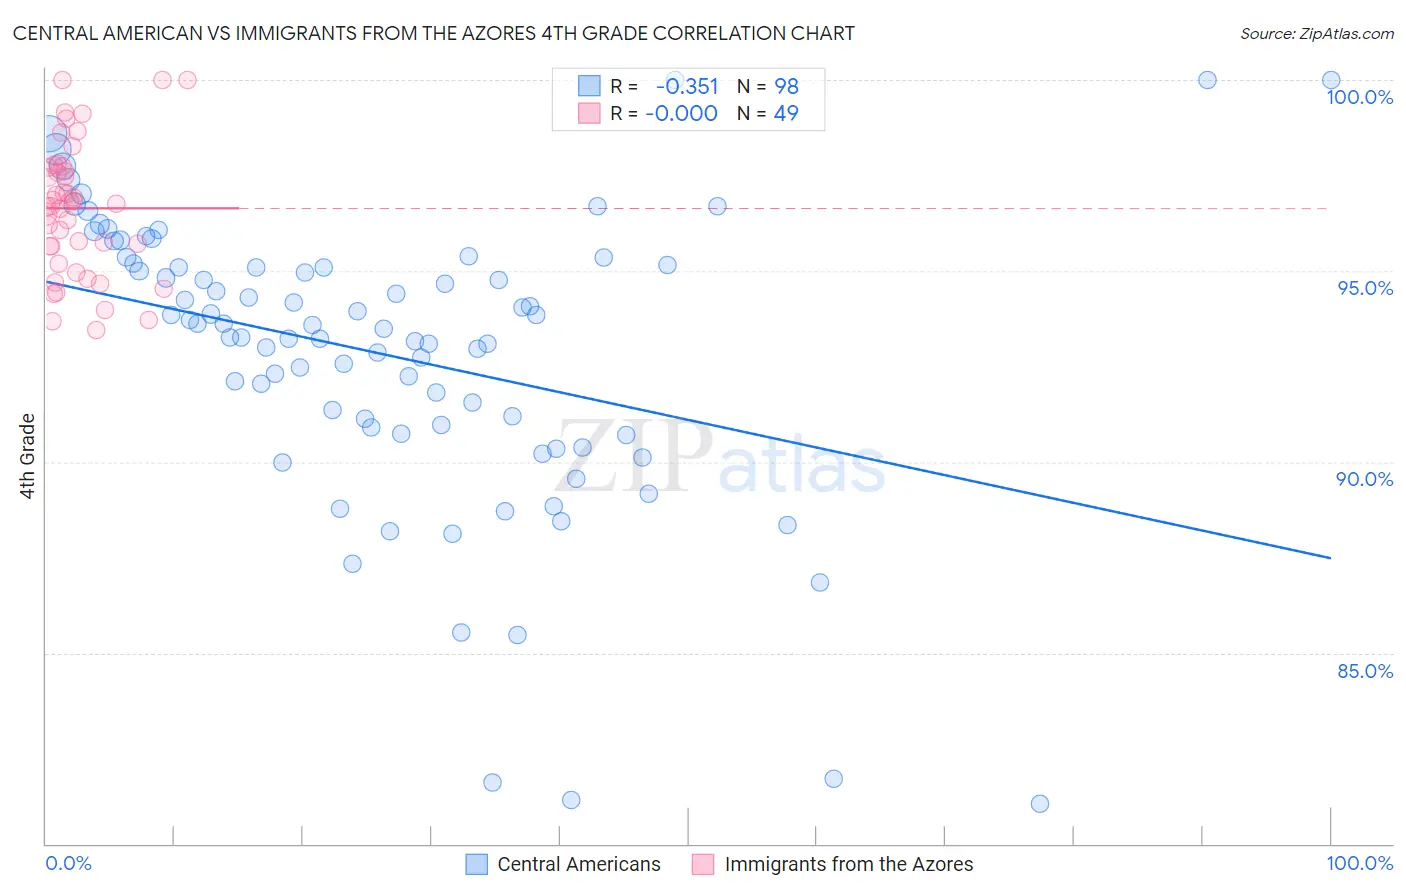
Central American vs Immigrants from the Azores 4th Grade Correlation Chart
The statistical analysis conducted on geographies consisting of 504,618,163 people shows a mild negative correlation between the proportion of Central Americans and percentage of population with at least 4th grade education in the United States with a correlation coefficient (R) of -0.351 and weighted average of 95.5%. Similarly, the statistical analysis conducted on geographies consisting of 46,257,310 people shows no correlation between the proportion of Immigrants from the Azores and percentage of population with at least 4th grade education in the United States with a correlation coefficient (R) of -0.000 and weighted average of 96.1%, a difference of 0.68%.
4th Grade Correlation Summary
| Measurement | Central American | Immigrants from the Azores |
| Minimum | 81.0% | 93.4% |
| Maximum | 100.0% | 100.0% |
| Range | 19.0% | 6.6% |
| Mean | 92.8% | 96.6% |
| Median | 93.5% | 96.8% |
| Interquartile 25% (IQ1) | 90.9% | 95.4% |
| Interquartile 75% (IQ3) | 95.2% | 97.7% |
| Interquartile Range (IQR) | 4.3% | 2.3% |
| Standard Deviation (Sample) | 3.8% | 1.7% |
| Standard Deviation (Population) | 3.8% | 1.7% |
Demographics Similar to Central Americans and Immigrants from the Azores by 4th Grade
In terms of 4th grade, the demographic groups most similar to Central Americans are Mexican (95.6%, a difference of 0.13%), Immigrants from Latin America (95.7%, a difference of 0.19%), Immigrants from Dominican Republic (95.7%, a difference of 0.26%), Immigrants from Cabo Verde (95.7%, a difference of 0.26%), and Immigrants from Honduras (95.8%, a difference of 0.31%). Similarly, the demographic groups most similar to Immigrants from the Azores are Belizean (96.1%, a difference of 0.020%), Central American Indian (96.2%, a difference of 0.040%), Bangladeshi (96.1%, a difference of 0.040%), Japanese (96.0%, a difference of 0.12%), and Immigrants from Vietnam (96.0%, a difference of 0.12%).
| Demographics | Rating | Rank | 4th Grade |
| Central American Indians | 0.0 /100 | #317 | Tragic 96.2% |
| Immigrants | Azores | 0.0 /100 | #318 | Tragic 96.1% |
| Belizeans | 0.0 /100 | #319 | Tragic 96.1% |
| Bangladeshis | 0.0 /100 | #320 | Tragic 96.1% |
| Japanese | 0.0 /100 | #321 | Tragic 96.0% |
| Immigrants | Vietnam | 0.0 /100 | #322 | Tragic 96.0% |
| Immigrants | Nicaragua | 0.0 /100 | #323 | Tragic 96.0% |
| Immigrants | Belize | 0.0 /100 | #324 | Tragic 96.0% |
| Dominicans | 0.0 /100 | #325 | Tragic 96.0% |
| Hispanics or Latinos | 0.0 /100 | #326 | Tragic 96.0% |
| Hondurans | 0.0 /100 | #327 | Tragic 96.0% |
| Mexican American Indians | 0.0 /100 | #328 | Tragic 95.8% |
| Immigrants | Cambodia | 0.0 /100 | #329 | Tragic 95.8% |
| Immigrants | Fiji | 0.0 /100 | #330 | Tragic 95.8% |
| Immigrants | Armenia | 0.0 /100 | #331 | Tragic 95.8% |
| Immigrants | Honduras | 0.0 /100 | #332 | Tragic 95.8% |
| Immigrants | Dominican Republic | 0.0 /100 | #333 | Tragic 95.7% |
| Immigrants | Cabo Verde | 0.0 /100 | #334 | Tragic 95.7% |
| Immigrants | Latin America | 0.0 /100 | #335 | Tragic 95.7% |
| Mexicans | 0.0 /100 | #336 | Tragic 95.6% |
| Central Americans | 0.0 /100 | #337 | Tragic 95.5% |