Central American vs Laotian Male Disability
COMPARE
Central American
Laotian
Male Disability
Male Disability Comparison
Central Americans
Laotians
10.8%
MALE DISABILITY
92.7/ 100
METRIC RATING
114th/ 347
METRIC RANK
10.6%
MALE DISABILITY
98.6/ 100
METRIC RATING
77th/ 347
METRIC RANK
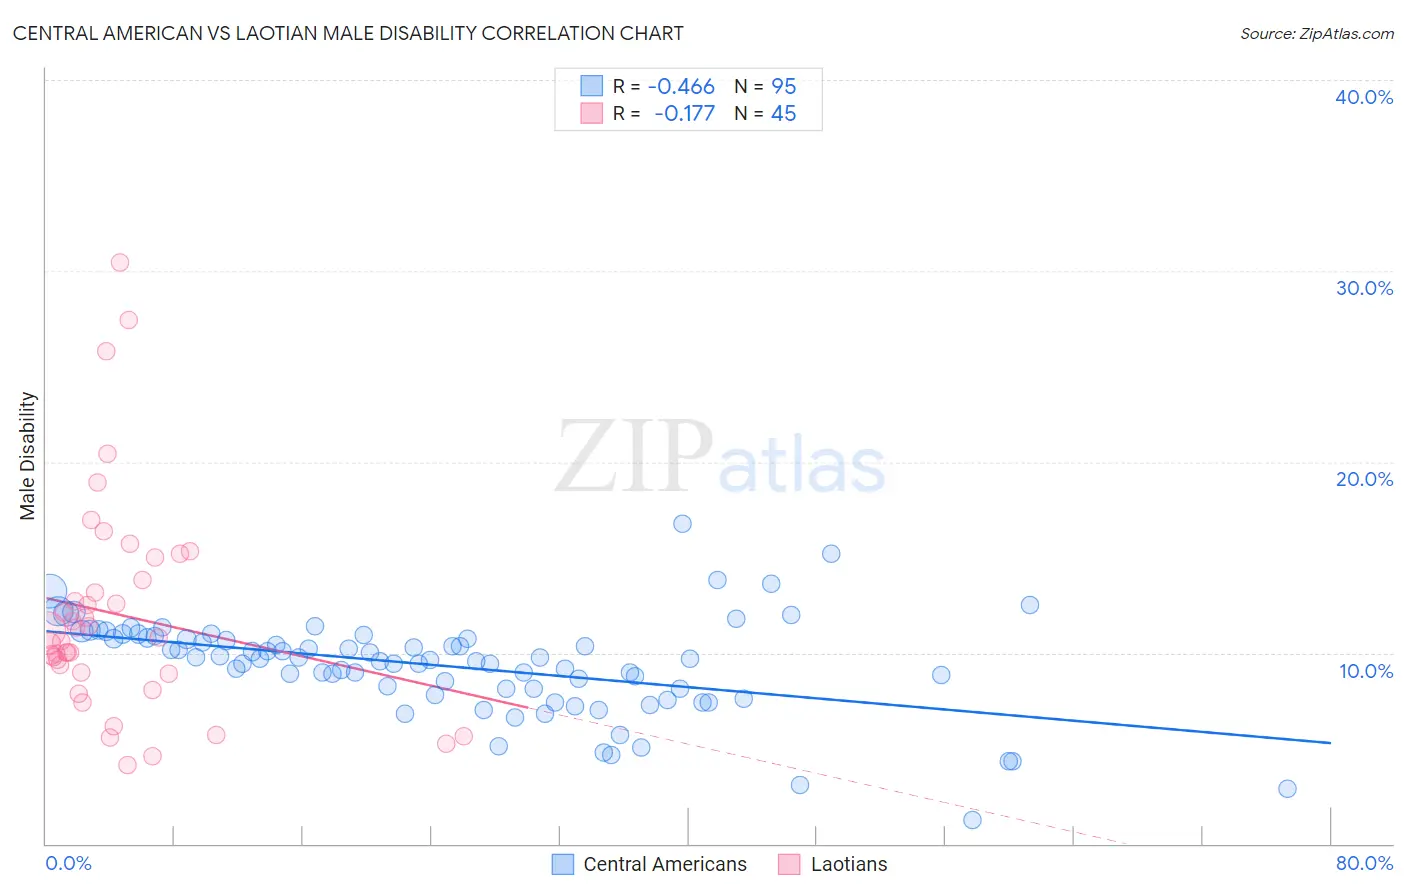
Central American vs Laotian Male Disability Correlation Chart
The statistical analysis conducted on geographies consisting of 504,432,725 people shows a moderate negative correlation between the proportion of Central Americans and percentage of males with a disability in the United States with a correlation coefficient (R) of -0.466 and weighted average of 10.8%. Similarly, the statistical analysis conducted on geographies consisting of 224,854,560 people shows a poor negative correlation between the proportion of Laotians and percentage of males with a disability in the United States with a correlation coefficient (R) of -0.177 and weighted average of 10.6%, a difference of 2.6%.
Male Disability Correlation Summary
| Measurement | Central American | Laotian |
| Minimum | 1.3% | 4.1% |
| Maximum | 16.7% | 30.4% |
| Range | 15.5% | 26.3% |
| Mean | 9.3% | 12.0% |
| Median | 9.7% | 10.8% |
| Interquartile 25% (IQ1) | 8.1% | 9.0% |
| Interquartile 75% (IQ3) | 10.8% | 14.4% |
| Interquartile Range (IQR) | 2.7% | 5.4% |
| Standard Deviation (Sample) | 2.5% | 5.7% |
| Standard Deviation (Population) | 2.5% | 5.6% |
Similar Demographics by Male Disability
Demographics Similar to Central Americans by Male Disability
In terms of male disability, the demographic groups most similar to Central Americans are Immigrants from Zimbabwe (10.8%, a difference of 0.070%), Immigrants from Barbados (10.8%, a difference of 0.10%), Ghanaian (10.8%, a difference of 0.15%), Immigrants from South Africa (10.8%, a difference of 0.17%), and Immigrants from Uruguay (10.8%, a difference of 0.25%).
| Demographics | Rating | Rank | Male Disability |
| Immigrants | Eastern Africa | 94.3 /100 | #107 | Exceptional 10.8% |
| Immigrants | Belgium | 94.2 /100 | #108 | Exceptional 10.8% |
| Immigrants | Uganda | 94.0 /100 | #109 | Exceptional 10.8% |
| Immigrants | Immigrants | 93.9 /100 | #110 | Exceptional 10.8% |
| Immigrants | Uruguay | 93.8 /100 | #111 | Exceptional 10.8% |
| Ghanaians | 93.4 /100 | #112 | Exceptional 10.8% |
| Immigrants | Zimbabwe | 93.0 /100 | #113 | Exceptional 10.8% |
| Central Americans | 92.7 /100 | #114 | Exceptional 10.8% |
| Immigrants | Barbados | 92.2 /100 | #115 | Exceptional 10.8% |
| Immigrants | South Africa | 91.8 /100 | #116 | Exceptional 10.8% |
| Eastern Europeans | 90.6 /100 | #117 | Exceptional 10.9% |
| Immigrants | Cuba | 90.2 /100 | #118 | Exceptional 10.9% |
| Armenians | 90.1 /100 | #119 | Exceptional 10.9% |
| Immigrants | Africa | 89.4 /100 | #120 | Excellent 10.9% |
| Immigrants | South Eastern Asia | 89.2 /100 | #121 | Excellent 10.9% |
Demographics Similar to Laotians by Male Disability
In terms of male disability, the demographic groups most similar to Laotians are Immigrants from Russia (10.6%, a difference of 0.020%), Immigrants from Sierra Leone (10.5%, a difference of 0.060%), Sierra Leonean (10.5%, a difference of 0.10%), Immigrants from Lebanon (10.5%, a difference of 0.21%), and Zimbabwean (10.6%, a difference of 0.25%).
| Demographics | Rating | Rank | Male Disability |
| Immigrants | Bulgaria | 99.1 /100 | #70 | Exceptional 10.5% |
| Immigrants | Cameroon | 99.0 /100 | #71 | Exceptional 10.5% |
| Immigrants | Serbia | 99.0 /100 | #72 | Exceptional 10.5% |
| Immigrants | Lithuania | 98.9 /100 | #73 | Exceptional 10.5% |
| Immigrants | Lebanon | 98.8 /100 | #74 | Exceptional 10.5% |
| Sierra Leoneans | 98.7 /100 | #75 | Exceptional 10.5% |
| Immigrants | Sierra Leone | 98.7 /100 | #76 | Exceptional 10.5% |
| Laotians | 98.6 /100 | #77 | Exceptional 10.6% |
| Immigrants | Russia | 98.6 /100 | #78 | Exceptional 10.6% |
| Zimbabweans | 98.4 /100 | #79 | Exceptional 10.6% |
| Immigrants | Jordan | 98.4 /100 | #80 | Exceptional 10.6% |
| Immigrants | Chile | 98.3 /100 | #81 | Exceptional 10.6% |
| Immigrants | Guyana | 98.2 /100 | #82 | Exceptional 10.6% |
| Immigrants | Poland | 98.1 /100 | #83 | Exceptional 10.6% |
| Bulgarians | 98.1 /100 | #84 | Exceptional 10.6% |