Central American vs Basque Male Disability
COMPARE
Central American
Basque
Male Disability
Male Disability Comparison
Central Americans
Basques
10.8%
MALE DISABILITY
92.7/ 100
METRIC RATING
114th/ 347
METRIC RANK
12.1%
MALE DISABILITY
0.3/ 100
METRIC RATING
258th/ 347
METRIC RANK
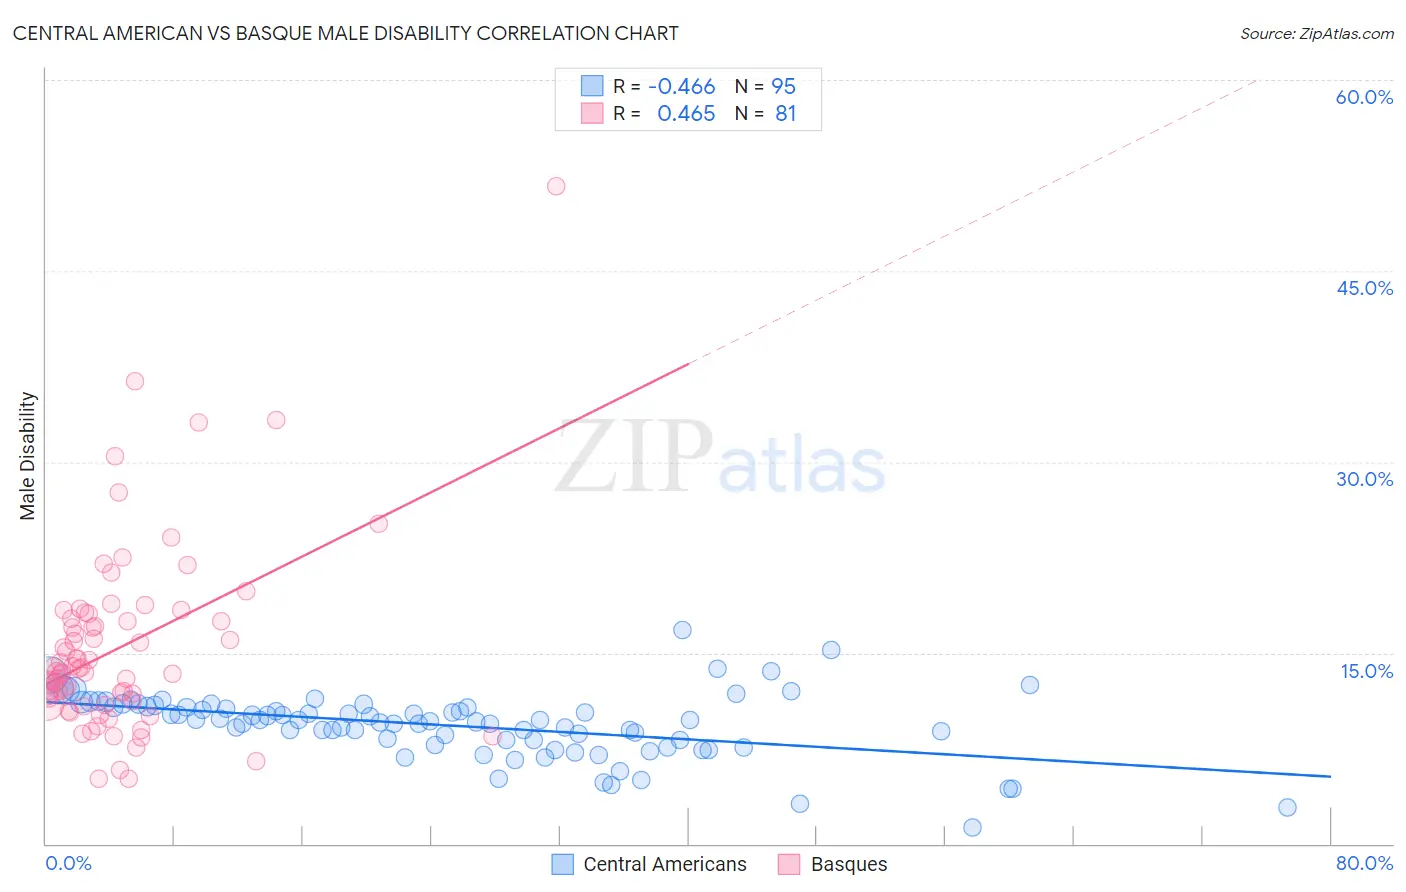
Central American vs Basque Male Disability Correlation Chart
The statistical analysis conducted on geographies consisting of 504,432,725 people shows a moderate negative correlation between the proportion of Central Americans and percentage of males with a disability in the United States with a correlation coefficient (R) of -0.466 and weighted average of 10.8%. Similarly, the statistical analysis conducted on geographies consisting of 165,777,747 people shows a moderate positive correlation between the proportion of Basques and percentage of males with a disability in the United States with a correlation coefficient (R) of 0.465 and weighted average of 12.1%, a difference of 12.0%.
Male Disability Correlation Summary
| Measurement | Central American | Basque |
| Minimum | 1.3% | 5.1% |
| Maximum | 16.7% | 51.7% |
| Range | 15.5% | 46.6% |
| Mean | 9.3% | 15.4% |
| Median | 9.7% | 13.8% |
| Interquartile 25% (IQ1) | 8.1% | 11.1% |
| Interquartile 75% (IQ3) | 10.8% | 17.9% |
| Interquartile Range (IQR) | 2.7% | 6.7% |
| Standard Deviation (Sample) | 2.5% | 7.4% |
| Standard Deviation (Population) | 2.5% | 7.3% |
Similar Demographics by Male Disability
Demographics Similar to Central Americans by Male Disability
In terms of male disability, the demographic groups most similar to Central Americans are Immigrants from Zimbabwe (10.8%, a difference of 0.070%), Immigrants from Barbados (10.8%, a difference of 0.10%), Ghanaian (10.8%, a difference of 0.15%), Immigrants from South Africa (10.8%, a difference of 0.17%), and Immigrants from Uruguay (10.8%, a difference of 0.25%).
| Demographics | Rating | Rank | Male Disability |
| Immigrants | Eastern Africa | 94.3 /100 | #107 | Exceptional 10.8% |
| Immigrants | Belgium | 94.2 /100 | #108 | Exceptional 10.8% |
| Immigrants | Uganda | 94.0 /100 | #109 | Exceptional 10.8% |
| Immigrants | Immigrants | 93.9 /100 | #110 | Exceptional 10.8% |
| Immigrants | Uruguay | 93.8 /100 | #111 | Exceptional 10.8% |
| Ghanaians | 93.4 /100 | #112 | Exceptional 10.8% |
| Immigrants | Zimbabwe | 93.0 /100 | #113 | Exceptional 10.8% |
| Central Americans | 92.7 /100 | #114 | Exceptional 10.8% |
| Immigrants | Barbados | 92.2 /100 | #115 | Exceptional 10.8% |
| Immigrants | South Africa | 91.8 /100 | #116 | Exceptional 10.8% |
| Eastern Europeans | 90.6 /100 | #117 | Exceptional 10.9% |
| Immigrants | Cuba | 90.2 /100 | #118 | Exceptional 10.9% |
| Armenians | 90.1 /100 | #119 | Exceptional 10.9% |
| Immigrants | Africa | 89.4 /100 | #120 | Excellent 10.9% |
| Immigrants | South Eastern Asia | 89.2 /100 | #121 | Excellent 10.9% |
Demographics Similar to Basques by Male Disability
In terms of male disability, the demographic groups most similar to Basques are Belgian (12.1%, a difference of 0.040%), Swedish (12.1%, a difference of 0.12%), Swiss (12.1%, a difference of 0.19%), European (12.1%, a difference of 0.19%), and Chinese (12.1%, a difference of 0.44%).
| Demographics | Rating | Rank | Male Disability |
| German Russians | 0.5 /100 | #251 | Tragic 12.0% |
| Slovenes | 0.5 /100 | #252 | Tragic 12.0% |
| Guamanians/Chamorros | 0.5 /100 | #253 | Tragic 12.0% |
| British | 0.4 /100 | #254 | Tragic 12.1% |
| Chinese | 0.4 /100 | #255 | Tragic 12.1% |
| Swiss | 0.3 /100 | #256 | Tragic 12.1% |
| Europeans | 0.3 /100 | #257 | Tragic 12.1% |
| Basques | 0.3 /100 | #258 | Tragic 12.1% |
| Belgians | 0.3 /100 | #259 | Tragic 12.1% |
| Swedes | 0.3 /100 | #260 | Tragic 12.1% |
| Slavs | 0.2 /100 | #261 | Tragic 12.2% |
| Norwegians | 0.2 /100 | #262 | Tragic 12.2% |
| Canadians | 0.2 /100 | #263 | Tragic 12.2% |
| Nepalese | 0.2 /100 | #264 | Tragic 12.2% |
| Immigrants | Portugal | 0.1 /100 | #265 | Tragic 12.3% |