Central American Indian vs German Russian Female Disability
COMPARE
Central American Indian
German Russian
Female Disability
Female Disability Comparison
Central American Indians
German Russians
13.6%
FEMALE DISABILITY
0.0/ 100
METRIC RATING
307th/ 347
METRIC RANK
12.6%
FEMALE DISABILITY
3.2/ 100
METRIC RATING
240th/ 347
METRIC RANK
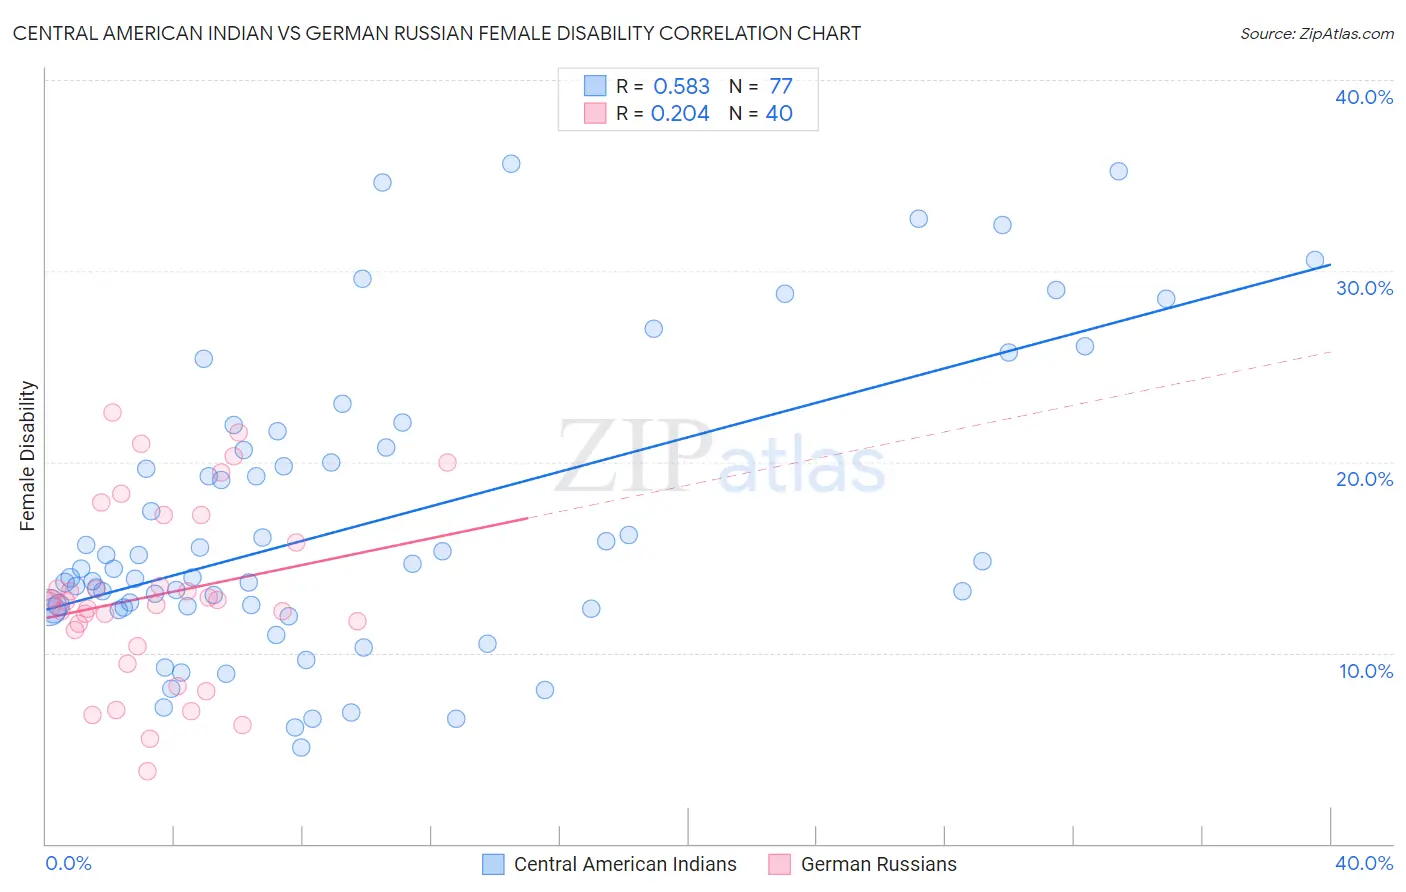
Central American Indian vs German Russian Female Disability Correlation Chart
The statistical analysis conducted on geographies consisting of 326,112,462 people shows a substantial positive correlation between the proportion of Central American Indians and percentage of females with a disability in the United States with a correlation coefficient (R) of 0.583 and weighted average of 13.6%. Similarly, the statistical analysis conducted on geographies consisting of 96,458,530 people shows a weak positive correlation between the proportion of German Russians and percentage of females with a disability in the United States with a correlation coefficient (R) of 0.204 and weighted average of 12.6%, a difference of 8.2%.
Female Disability Correlation Summary
| Measurement | Central American Indian | German Russian |
| Minimum | 5.1% | 3.8% |
| Maximum | 35.6% | 22.6% |
| Range | 30.5% | 18.8% |
| Mean | 16.8% | 13.0% |
| Median | 14.4% | 12.6% |
| Interquartile 25% (IQ1) | 12.3% | 10.8% |
| Interquartile 75% (IQ3) | 20.7% | 16.5% |
| Interquartile Range (IQR) | 8.3% | 5.7% |
| Standard Deviation (Sample) | 7.6% | 4.7% |
| Standard Deviation (Population) | 7.5% | 4.6% |
Similar Demographics by Female Disability
Demographics Similar to Central American Indians by Female Disability
In terms of female disability, the demographic groups most similar to Central American Indians are French Canadian (13.6%, a difference of 0.29%), Cree (13.7%, a difference of 0.46%), French American Indian (13.7%, a difference of 0.52%), Apache (13.7%, a difference of 0.63%), and Dominican (13.5%, a difference of 0.92%).
| Demographics | Rating | Rank | Female Disability |
| Pennsylvania Germans | 0.0 /100 | #300 | Tragic 13.4% |
| Africans | 0.0 /100 | #301 | Tragic 13.4% |
| Scotch-Irish | 0.0 /100 | #302 | Tragic 13.4% |
| Immigrants | Portugal | 0.0 /100 | #303 | Tragic 13.5% |
| Immigrants | Micronesia | 0.0 /100 | #304 | Tragic 13.5% |
| Dominicans | 0.0 /100 | #305 | Tragic 13.5% |
| French Canadians | 0.0 /100 | #306 | Tragic 13.6% |
| Central American Indians | 0.0 /100 | #307 | Tragic 13.6% |
| Cree | 0.0 /100 | #308 | Tragic 13.7% |
| French American Indians | 0.0 /100 | #309 | Tragic 13.7% |
| Apache | 0.0 /100 | #310 | Tragic 13.7% |
| Hopi | 0.0 /100 | #311 | Tragic 13.7% |
| Delaware | 0.0 /100 | #312 | Tragic 13.8% |
| Blackfeet | 0.0 /100 | #313 | Tragic 13.8% |
| Puget Sound Salish | 0.0 /100 | #314 | Tragic 13.8% |
Demographics Similar to German Russians by Female Disability
In terms of female disability, the demographic groups most similar to German Russians are Barbadian (12.6%, a difference of 0.090%), Yugoslavian (12.6%, a difference of 0.13%), Slavic (12.6%, a difference of 0.15%), Japanese (12.6%, a difference of 0.17%), and Canadian (12.6%, a difference of 0.22%).
| Demographics | Rating | Rank | Female Disability |
| Immigrants | Iraq | 5.3 /100 | #233 | Tragic 12.5% |
| Scandinavians | 5.3 /100 | #234 | Tragic 12.5% |
| Malaysians | 5.0 /100 | #235 | Tragic 12.5% |
| Immigrants | West Indies | 4.4 /100 | #236 | Tragic 12.6% |
| Slavs | 3.8 /100 | #237 | Tragic 12.6% |
| Yugoslavians | 3.7 /100 | #238 | Tragic 12.6% |
| Barbadians | 3.6 /100 | #239 | Tragic 12.6% |
| German Russians | 3.2 /100 | #240 | Tragic 12.6% |
| Japanese | 2.7 /100 | #241 | Tragic 12.6% |
| Canadians | 2.6 /100 | #242 | Tragic 12.6% |
| Immigrants | Senegal | 2.5 /100 | #243 | Tragic 12.6% |
| Alsatians | 2.5 /100 | #244 | Tragic 12.6% |
| Immigrants | Jamaica | 2.2 /100 | #245 | Tragic 12.6% |
| Spanish American Indians | 2.1 /100 | #246 | Tragic 12.6% |
| Menominee | 2.1 /100 | #247 | Tragic 12.6% |