Central American Indian vs German Russian Householder Income Ages 45 - 64 years
COMPARE
Central American Indian
German Russian
Householder Income Ages 45 - 64 years
Householder Income Ages 45 - 64 years Comparison
Central American Indians
German Russians
$86,764
HOUSEHOLDER INCOME AGES 45 - 64 YEARS
0.1/ 100
METRIC RATING
284th/ 347
METRIC RANK
$89,398
HOUSEHOLDER INCOME AGES 45 - 64 YEARS
0.4/ 100
METRIC RATING
257th/ 347
METRIC RANK
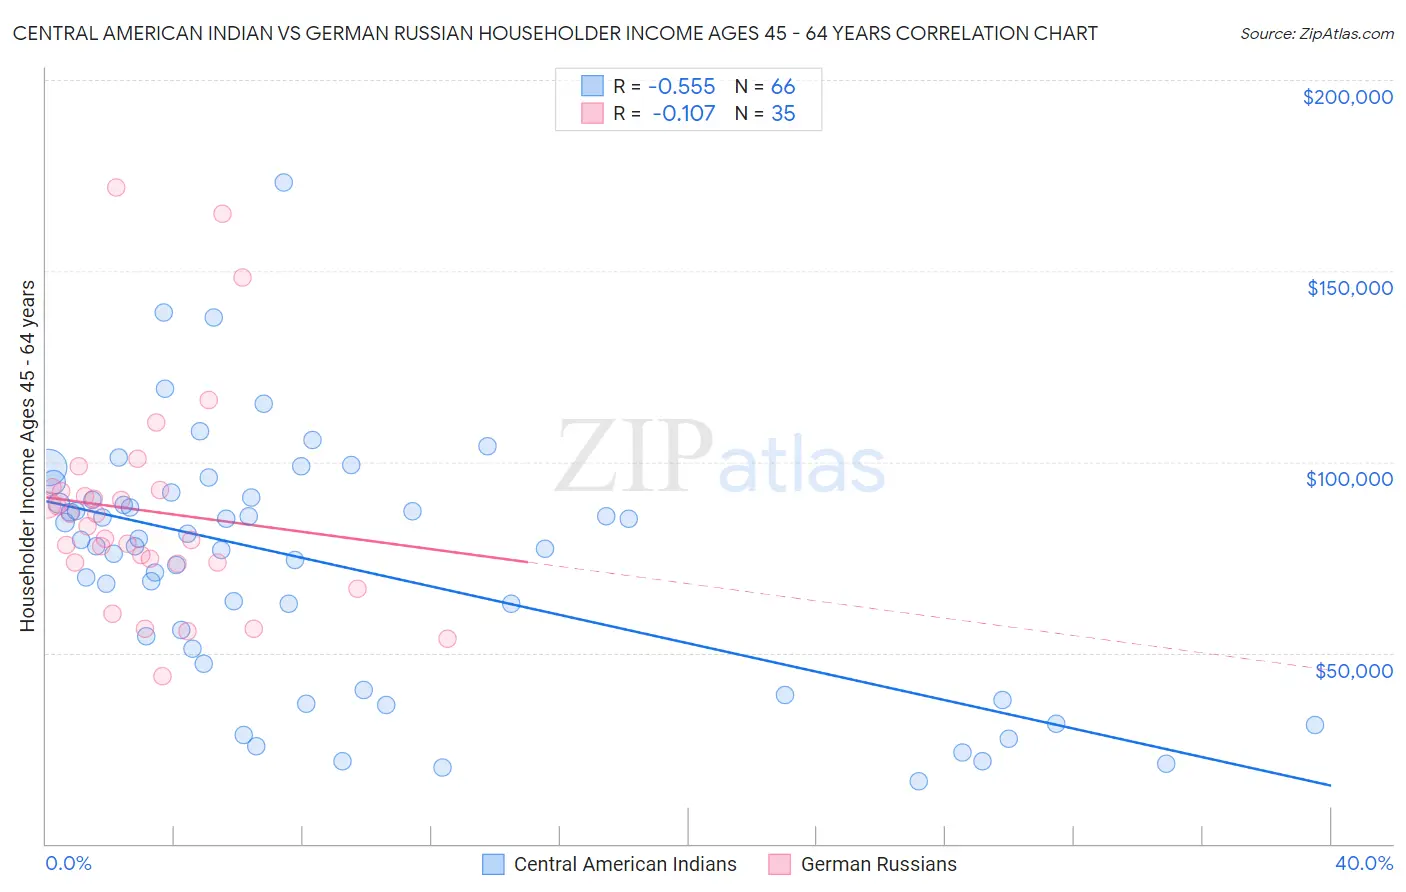
Central American Indian vs German Russian Householder Income Ages 45 - 64 years Correlation Chart
The statistical analysis conducted on geographies consisting of 325,794,243 people shows a substantial negative correlation between the proportion of Central American Indians and household income with householder between the ages 45 and 64 in the United States with a correlation coefficient (R) of -0.555 and weighted average of $86,764. Similarly, the statistical analysis conducted on geographies consisting of 96,410,243 people shows a poor negative correlation between the proportion of German Russians and household income with householder between the ages 45 and 64 in the United States with a correlation coefficient (R) of -0.107 and weighted average of $89,398, a difference of 3.0%.
Householder Income Ages 45 - 64 years Correlation Summary
| Measurement | Central American Indian | German Russian |
| Minimum | $16,412 | $43,750 |
| Maximum | $173,000 | $171,788 |
| Range | $156,588 | $128,038 |
| Mean | $72,864 | $87,182 |
| Median | $78,027 | $83,043 |
| Interquartile 25% (IQ1) | $47,059 | $73,744 |
| Interquartile 75% (IQ3) | $90,095 | $92,651 |
| Interquartile Range (IQR) | $43,036 | $18,907 |
| Standard Deviation (Sample) | $32,226 | $28,210 |
| Standard Deviation (Population) | $31,981 | $27,804 |
Similar Demographics by Householder Income Ages 45 - 64 years
Demographics Similar to Central American Indians by Householder Income Ages 45 - 64 years
In terms of householder income ages 45 - 64 years, the demographic groups most similar to Central American Indians are Mexican ($86,816, a difference of 0.060%), Senegalese ($86,897, a difference of 0.15%), Yaqui ($86,914, a difference of 0.17%), Blackfeet ($86,595, a difference of 0.20%), and Immigrants from Guatemala ($86,573, a difference of 0.22%).
| Demographics | Rating | Rank | Householder Income Ages 45 - 64 years |
| Cree | 0.1 /100 | #277 | Tragic $87,185 |
| Immigrants | Jamaica | 0.1 /100 | #278 | Tragic $87,035 |
| Yakama | 0.1 /100 | #279 | Tragic $86,992 |
| Immigrants | Somalia | 0.1 /100 | #280 | Tragic $86,987 |
| Yaqui | 0.1 /100 | #281 | Tragic $86,914 |
| Senegalese | 0.1 /100 | #282 | Tragic $86,897 |
| Mexicans | 0.1 /100 | #283 | Tragic $86,816 |
| Central American Indians | 0.1 /100 | #284 | Tragic $86,764 |
| Blackfeet | 0.1 /100 | #285 | Tragic $86,595 |
| Immigrants | Guatemala | 0.1 /100 | #286 | Tragic $86,573 |
| Bangladeshis | 0.1 /100 | #287 | Tragic $86,402 |
| Immigrants | St. Vincent and the Grenadines | 0.1 /100 | #288 | Tragic $86,394 |
| Cubans | 0.1 /100 | #289 | Tragic $86,301 |
| Cherokee | 0.1 /100 | #290 | Tragic $86,125 |
| Hispanics or Latinos | 0.1 /100 | #291 | Tragic $86,006 |
Demographics Similar to German Russians by Householder Income Ages 45 - 64 years
In terms of householder income ages 45 - 64 years, the demographic groups most similar to German Russians are Immigrants from Barbados ($89,394, a difference of 0.0%), Immigrants from Nicaragua ($89,108, a difference of 0.33%), French American Indian ($89,811, a difference of 0.46%), Liberian ($88,929, a difference of 0.53%), and West Indian ($89,906, a difference of 0.57%).
| Demographics | Rating | Rank | Householder Income Ages 45 - 64 years |
| Sub-Saharan Africans | 0.8 /100 | #250 | Tragic $90,691 |
| Americans | 0.7 /100 | #251 | Tragic $90,536 |
| Marshallese | 0.7 /100 | #252 | Tragic $90,455 |
| Barbadians | 0.6 /100 | #253 | Tragic $90,266 |
| Immigrants | Guyana | 0.6 /100 | #254 | Tragic $90,186 |
| West Indians | 0.5 /100 | #255 | Tragic $89,906 |
| French American Indians | 0.5 /100 | #256 | Tragic $89,811 |
| German Russians | 0.4 /100 | #257 | Tragic $89,398 |
| Immigrants | Barbados | 0.4 /100 | #258 | Tragic $89,394 |
| Immigrants | Nicaragua | 0.4 /100 | #259 | Tragic $89,108 |
| Liberians | 0.3 /100 | #260 | Tragic $88,929 |
| Belizeans | 0.3 /100 | #261 | Tragic $88,684 |
| Somalis | 0.3 /100 | #262 | Tragic $88,600 |
| Immigrants | Senegal | 0.3 /100 | #263 | Tragic $88,421 |
| Osage | 0.3 /100 | #264 | Tragic $88,390 |