Ugandan vs German Russian Disability
COMPARE
Ugandan
German Russian
Disability
Disability Comparison
Ugandans
German Russians
11.4%
DISABILITY
87.9/ 100
METRIC RATING
135th/ 347
METRIC RANK
12.3%
DISABILITY
0.8/ 100
METRIC RATING
254th/ 347
METRIC RANK
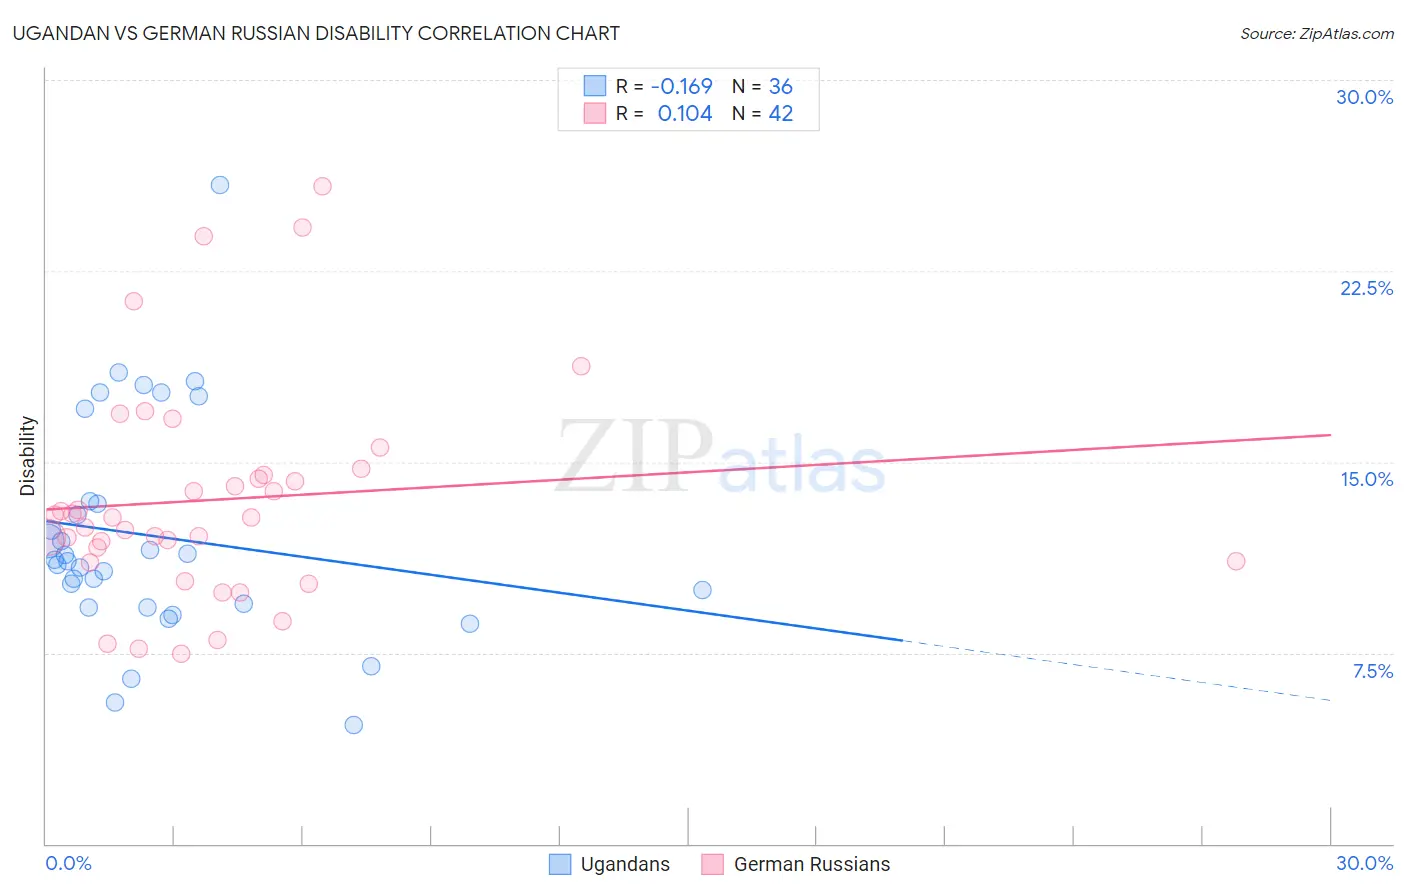
Ugandan vs German Russian Disability Correlation Chart
The statistical analysis conducted on geographies consisting of 94,018,396 people shows a poor negative correlation between the proportion of Ugandans and percentage of population with a disability in the United States with a correlation coefficient (R) of -0.169 and weighted average of 11.4%. Similarly, the statistical analysis conducted on geographies consisting of 96,458,633 people shows a poor positive correlation between the proportion of German Russians and percentage of population with a disability in the United States with a correlation coefficient (R) of 0.104 and weighted average of 12.3%, a difference of 7.7%.
Disability Correlation Summary
| Measurement | Ugandan | German Russian |
| Minimum | 4.7% | 7.4% |
| Maximum | 25.9% | 25.8% |
| Range | 21.2% | 18.4% |
| Mean | 12.1% | 13.5% |
| Median | 11.1% | 12.8% |
| Interquartile 25% (IQ1) | 9.4% | 11.1% |
| Interquartile 75% (IQ3) | 13.4% | 14.5% |
| Interquartile Range (IQR) | 4.1% | 3.4% |
| Standard Deviation (Sample) | 4.3% | 4.2% |
| Standard Deviation (Population) | 4.3% | 4.2% |
Similar Demographics by Disability
Demographics Similar to Ugandans by Disability
In terms of disability, the demographic groups most similar to Ugandans are Immigrants from St. Vincent and the Grenadines (11.4%, a difference of 0.010%), Immigrants from Guyana (11.4%, a difference of 0.050%), Kenyan (11.5%, a difference of 0.080%), New Zealander (11.5%, a difference of 0.090%), and Ghanaian (11.5%, a difference of 0.10%).
| Demographics | Rating | Rank | Disability |
| Immigrants | Europe | 90.4 /100 | #128 | Exceptional 11.4% |
| Macedonians | 90.3 /100 | #129 | Exceptional 11.4% |
| Latvians | 89.8 /100 | #130 | Excellent 11.4% |
| Immigrants | Croatia | 89.8 /100 | #131 | Excellent 11.4% |
| Immigrants | Africa | 89.3 /100 | #132 | Excellent 11.4% |
| Arabs | 89.1 /100 | #133 | Excellent 11.4% |
| Immigrants | Guyana | 88.3 /100 | #134 | Excellent 11.4% |
| Ugandans | 87.9 /100 | #135 | Excellent 11.4% |
| Immigrants | St. Vincent and the Grenadines | 87.8 /100 | #136 | Excellent 11.4% |
| Kenyans | 87.1 /100 | #137 | Excellent 11.5% |
| New Zealanders | 87.0 /100 | #138 | Excellent 11.5% |
| Ghanaians | 87.0 /100 | #139 | Excellent 11.5% |
| Russians | 86.8 /100 | #140 | Excellent 11.5% |
| Immigrants | Grenada | 86.1 /100 | #141 | Excellent 11.5% |
| Immigrants | Sudan | 85.3 /100 | #142 | Excellent 11.5% |
Demographics Similar to German Russians by Disability
In terms of disability, the demographic groups most similar to German Russians are Belgian (12.3%, a difference of 0.030%), Bermudan (12.3%, a difference of 0.33%), Slovene (12.4%, a difference of 0.33%), Immigrants from Dominica (12.4%, a difference of 0.39%), and Immigrants from Laos (12.4%, a difference of 0.49%).
| Demographics | Rating | Rank | Disability |
| Indonesians | 1.4 /100 | #247 | Tragic 12.2% |
| Guamanians/Chamorros | 1.4 /100 | #248 | Tragic 12.3% |
| Carpatho Rusyns | 1.4 /100 | #249 | Tragic 12.3% |
| Sub-Saharan Africans | 1.4 /100 | #250 | Tragic 12.3% |
| Europeans | 1.4 /100 | #251 | Tragic 12.3% |
| Bermudans | 1.1 /100 | #252 | Tragic 12.3% |
| Belgians | 0.8 /100 | #253 | Tragic 12.3% |
| German Russians | 0.8 /100 | #254 | Tragic 12.3% |
| Slovenes | 0.6 /100 | #255 | Tragic 12.4% |
| Immigrants | Dominica | 0.6 /100 | #256 | Tragic 12.4% |
| Immigrants | Laos | 0.5 /100 | #257 | Tragic 12.4% |
| Slavs | 0.5 /100 | #258 | Tragic 12.4% |
| Canadians | 0.4 /100 | #259 | Tragic 12.4% |
| Immigrants | Liberia | 0.4 /100 | #260 | Tragic 12.4% |
| Scandinavians | 0.4 /100 | #261 | Tragic 12.4% |